AGRI-PROFILE: VICTORIA, ORIENTAL MINDORO
Victoria, Oriental Mindoro
Victoria, officially the Municipality of Victoria, is a 2nd class municipality in the province of Oriental Mindoro, Philippines. According to the 2015 census, it has a population of 50,492 people.
The Municipality of Victoria is known as “Fruit Basket of Oriental Mindoro” and celebrates its annual Kapakyanan Festival every October 15 as graces and thanks giving for the bountiful blessings that every Victoreños received from God. It is 36 kilometres (22 mi) from Calapan.
Crops
The economic base of the municipality is basically agricultural with almost 30% of its total land area being utilized for production of different crops and agricultural commodities. The comparative presentation of the agricultural area and production in the preceding discussions were derived from the records of the Municipal Agriculture Office. For purposes of analysis, the following assumptions will be applied:
- 1. High-value commercial crops composed of fruit trees and industrial crops are usually intercropped. The area is computed based on the number of productive trees planted multiplied by the standard area per crop or standard distance from another crop;
- 2. Area and location for vegetable and rootcrops differ per year; and
- 3. Total area reflected for rice is based on the area planted for a particular year.
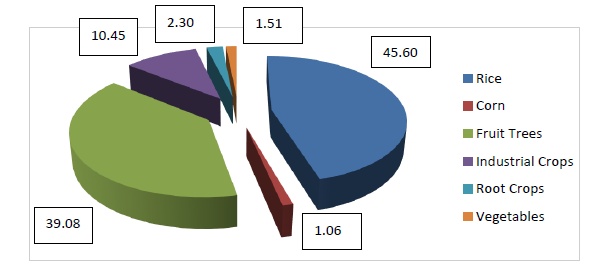
In 2014, Victoria utilized about 11,773.58 hectares (ha) of the municipality’s agricultural area while in 2013, about 13,385 ha were made productive. For 2014, about 45.60% of the agricultural lands are devoted to rice farming, 39.08% to fruit tree or orchard farming and the remaining 3.81% is devoted to other high value commercial crops such as vegetables and root crops. Industrial crops composed of coconut, cacao, coffee, banana and pineapple constitute about 10.45% while corn is merely 1.06% of the total agricultural area.
Area devoted to Agriculture, 2014
| Category | 2013 | 2014 | ||
| Area (Hectares) | % Devoted to Agriculture | Area (Hectares) | % Devoted to Agriculture | |
| Total Land Area | 45,494.42 | 29.42 | 45,494.42 | 25.88 |
| otal Agricultural Land | 13,385.14 | 100.00 | 11,773.58 | 100.00 |
| Rice | 5,402.00 | 40.36 | 5,369.00 | 45.60 |
| Corn | 150.50 | 1.12 | 125 | 1.06 |
| Vegetable | 159.36 | 1.19 | 178 | 1.51 |
| Root Crops | 167.25 | 1.25 | 270.25 | 2.30 |
| Industrial Crops | 1,372.00 | 10.25 | 1,230.54 | 10.45 |
| Fruit Trees | 6,134.03 | 45.83 | 4,600.79 | 39.08 |
| Source: Municipal Agriculture Office, 2014 | ||||
There are several market outlets of rice, fruits and industrial crops in other municipalities in regions MIMAROPA and CALABARZON, as well as in Metro Socio-Economic and Physical Profile Municipality of Victoria Page | 112 Manila and other provinces. Value of each commodity varies on supply and demand particularly on citrus and rambutan.
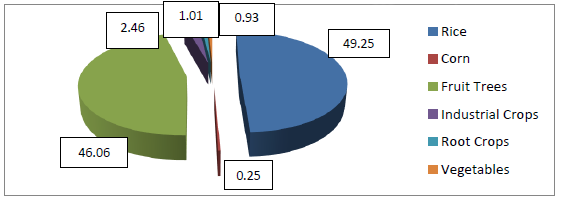
In terms of the volume of production, rice accounted for 49.25% of the total agricultural production of the municipality. Fruit trees was second to rice production with 43,165 metric tons (MT) or 46.06% followed by industrial crops with 2.46% or 2,306.68 MT of the total municipal agricultural output. Total crop production for 2014 is 93,710.06 MT.
Existing Major Agricultural Crops by Area, Production and Market, Year 2014
| Major Crops | Brgy. | Production Volume | Percentage | Market |
| Rice | 46,153.37 | 49.25 | Provincewide, NCR and other regions | |
| Corn | 2 | 269.50 | 0.29 | Provincewide |
| Fruit Trees | 23 | 43,165.73 | 46.06 | Provincewide, Region IV, NCR and other regions |
| Industrial | 27 | 2,306.68 | 2.46 | Provincewide, Region IV, NCR and other regions |
| Vegetables | 23 | 872.78 | 0.93 | Provincewide |
| Root crops | 20 | 942.00 | 1.01 | Provincewide |
| TOTAL | 93,710.06 | 100.00 | ||
| Source: Municipal Agriculture Office, 2014 | ||||
Table below shows the comparative agricultural crop areas and production for the year 2013 and 2014. It can be noted that while the area of vegetable and root crops increased by 74.45% and 131.37%, the volume of production decreased by 9.92% and 8.89%, respectively due to calamities, particularly strong winds and typhoon which affected the crops. The decrease in production of fruits can be attributed to extreme weather conditions and climate change that prevent the flowering trees to continue developing into fruits. The figures below show the details/distribution of volume of production of six major crops and its area.
Despite the decrease in area planted to rice by .61 hectares, production increased by 43.18 MT. Use of certified seeds and high breed seeds in 2014 led to the increase in production of rice from 40,518.66 in 2013 to 42,142.58 in 2014. A total of 1,200 bags of certified seeds and 200 bags of high breed seeds were distributed to around 700 farmers in 25 rice producing barangays in year 2014.
Comparative Agricultural Crop Areas and Production (MT), 2013 and 2014
| Major Crops | Area (has.) | Volume of Production (MT) | ||||
| 2013 | 2014 | Increase/Decrease | 2013 | 2014 | Increase/Decrease | |
| Rice | 5,402.00 | 5,369.00 | (0.61) | 32,234.59 | 46,153.37 | 43.18 |
| Corn | 150.50 | 125.00 | (16.94) | 135.50 | 269.50 | 98.89 |
| Fruit | Trees | 6,134.03 | 4,600.78 | (25.00) | 61,270.43 | 43,165.73 |
| Industrial | Crop | 1,372.00 | 1,230.54 | (10.31) | 2,560.88 | 2,306.68 |
| Vegetables | 159.36 | 178.00 | 11.70 | 958.00 | 872.78 | (8.90) |
| Root Crops | 167.25 | 270.25 | 61.58 | 1,051.25 | 942.00 | (10.39) |
| 13,385.14 | 11,773.57 | (12.04) | ||||
Land Area Devoted to Agricultural Production, 2014
The table below shows the different farm machinery and post-harvest facilities. Most of the farmers used farm tractors in tilling the land in all kind of crops, particularly in wide areas. There were 27 units of farm tractors, three units came from the Department of Agriculture (DA) where one unit was granted to Mindoro State College of Agriculture and Technology (MinSCAT), one unit to Oriental Mindoro Agricultural Experimentation Station (ORMAES) both at barangay Alcate, and one unit to the Local Government Unit (LGU) of Victoria that is being used by farmers. There were 23 units which were privately owned by big land owners from 10 barangays. Likewise, hand tractors were used in rice production— lowland & irrigated areas. Operationally 451 units were found in 25 rice producing barangay and privately owned by individual rice farmers. One unit with complete accessories was given to San Juan Nepomuceno Farmers Association in barangay San Juan through counter-parting scheme. As of now, few farmers use animals in their crop production. Draft animals are commonly used by marginal farmers, particularly IPs in their production.
Existing Agricultural Support Facilities and Services, Year 2014
| Post-harvest Facilities And Support Services | Location | Number | Type/ Capacity | Remarks |
|---|---|---|---|---|
| Milling | 15 barangays | 37 | Operational | |
| MPDP | 24 barangays | 85 | Operational | |
| Bagong Buhay | 1 | 100 bag per load | Operational | |
| Macatoc | 1 | -do- | Operational | |
| Mabini | 1 | -do- | Need Repair | |
| San Isidro | 1 | -do- | Operational | |
| San Narciso | 1 | -do- | Operational | |
| Babangonan | 4 | -do- | Operational | |
| Mechanical Drier | Sub-total | 15 | ||
| Alcate | 1 | 100 bag per load | Operational | |
| Urdaneta | 1 | -do- | Operational | |
| Mabini | 2 | -do- | Operational | |
| Pob.3 | 1 | -do- | Operational | |
| Flatbed Drier | Sub-total | 7 | ||
| Rice Thresher | 24 barangay | 256 | 35-40 bag/hour | Operational & need repair |
| Bagong Buhay | 1 | Operational | ||
| Alcate | 3 | Operational | ||
| Macatoc | 7 | Operational | ||
| Mabini | 4 | Operational | ||
| San Narciso | 2 | Operational | ||
| Urdaneta | 1 | Operational | ||
| Babangonan | 2 | Operational | ||
| Leido | 5 | Operational | ||
| San Juan | 1 | Operational | ||
| Poblacion IV | 1 | Operational | ||
| Farm Tractor | Sub-total | 27 | Operational | |
| Hand Tractor | 24 barangays | 451 | 25 to 30 bag/hour | Operational & need repair |
| Bagong Buhay | 1 | 20 bag/hour | Operational | |
| Alcate | 1 | |||
| Corn Sheller | Sub-total | 2 | ||
| Pob.1 | 2 | Operational | ||
| Macatoc | 1 | Operational | ||
| Market Center | Sub-total | 3 | Operational | |
| Warehouse | 11 barangay | 44 | Operational | |
| 4-wheel tractor | 29 | Operational | ||
| Combine harvester | 16 | Operational | ||
| Water pump | 175 | Operational |
With the continuing information and education campaign of the DA, the Provincial Government of Oriental Mindoro and the Municipal Government of Victoria, with the support of the rural-based organizations, the farming systems of the farming communities are now gradually changing from conventional farming into a natural farming system accounted to about 30% of farmers involved. This is manifested by the organization of different natural farmers’ association in the municipality and clamors to undergo natural farming systems training.
A. Rice Production
Of the 32 barangays of Victoria, 25 are rice producing, covering a total land area of 5,369 hectares, 85.03% of which is irrigated. Total production reached 40,518.66 MT, 88.06% of which is produced by the irrigated areas.
San Narciso, Urdaneta, and Babangonan have the biggest area of irrigated riceland at 710, 497 and 336 has, respectively. In terms of production in irrigated areas, San Narciso’s production was at its peak at 5,948.25 MT, highest of all the 25 irrigated rice producing barangays, followed by Urdaneta and Mabini. Babangonan is third in terms of area of irrigated riceland but 11th in terms of production in irrigated areas.
Total non-irrigated area based on the records of the Municipal Agriculture Office is 804 has. Barangays with large non-irrigated areas include Macatoc, Urdaneta, and Malabo.
In terms of total production both from irrigated and non-irrigated areas, San Narciso ranks first with total production of 5,317.80 MT followed by Urdaneta and Malabo with total production of 5,317.80 MT and 3,735.00 MT, respectively.
As a whole, the seven lakeside barangays have significant contribution to the production of rice in Victoria with total production of 19,621 MT, representing 48.42% of the municipality’s total rice production. These rice fields, however are exposed to flooding and in dire need of technical assistance and intervention. Farmers should be trained on climate-smart agriculture through the adoption of a new planting calendar, as well as climate-resilient varieties of planting materials.
Rice Area and Production per Barangay, 2014
| # | Barangay | Irrigated | Non-Irrigated | Total | |||
| Area in hectares | Production (MT) | Area in hectares | Production (MT) | Area in hectares | Production (MT) | ||
| 1 | Alcate | 228.00 | 1,798.12 | 32.00 | 233.00 | 260.00 | 2,031.12 |
| 2 | Antonino | 128.00 | 1,038.25 | 37.00 | 301.75 | 165.00 | 1,340.00 |
| 3 | Babangonan | 336.00 | 1,316.00 | 72.00 | 228.00 | 408.00 | 1,544.00 |
| 4 | Bagong Buhay | 126.00 | 1,008.00 | 6.00 | 22.00 | 132.00 | 1,030.00 |
| 5 | Bambanin | ||||||
| 6 | Bethel | 85.00 | 895.00 | 85.00 | 895.00 | ||
| 7 | Canaan | 100.00 | 1,660.00 | 100.00 | 1,660.00 | ||
| 8 | Doungan | 156.00 | 1,766.00 | 58.50 | 465.08 | 214.50 | 2,231.08 |
| 9 | Leido | 225.00 | 2,253.00 | 225.00 | 2,253.00 | ||
| 10 | Mabini | 287.00 | 2,870.00 | 287.00 | 2,870.00 | ||
| 11 | Macatoc | 311.00 | 2,071.00 | 152.75 | 1,135.12 | 463.75 | 3,206.12 |
| 12 | Malabo | 314.00 | 2,635.50 | 135.00 | 1,099.50 | 449.00 | 3,735.00 |
| 13 | Merit | 54.00 | 136.00 | 54.00 | 136.00 | ||
| 14 | Ordovilla | 99.00 | 445.50 | 99.00 | 445.50 | ||
| 15 | Pakyas | 123.00 | 1,016.18 | 123.00 | 1,016.18 | ||
| 16 | Pob.1 | 128.00 | 1,129.85 | 16.00 | 128.00 | 144.00 | 1,257.85 |
| 17 | Pob.2 | 76.00 | 668.00 | 76.00 | 668.00 | ||
| 18 | Pob.3 | 99.00 | 674.50 | 27.00 | 117.65 | 126.00 | 792.15 |
| 19 | Pob.4 | 173.50 | 1,226.75 | 11.50 | 77.25 | 185.00 | 1,304.00 |
| 20 | San Gabriel | 15.00 | 63.75 | 15.00 | 63.75 | ||
| 21 | San Gelacio | 35.00 | 148.75 | 35.00 | 148.75 | ||
| 22 | San Juan | 183.50 | 1,396.43 | 93.00 | 657.51 | 276.50 | 2,053.94 |
| 23 | San Narciso | 711.00 | 5,948.25 | 711.00 | 5,948.25 | ||
| 24 | Urdaneta | 497.00 | 4,317.80 | 125.00 | 1,000.00 | 622.00 | 5,317.80 |
| 25 | Villa Cerveza | 75.00 | 597.27 | 38.25 | 250.60 | 113.25 | 847.87 |
| TOTAL | 4,565.00 | 34,743.21 | 804.00 | 6,153.99 | 5,369.00 | 40,518.66 | |
| % to TOTAL | 85.03 | 85.75 | 14.97 | 15.19 | 100.00 | 100.00 | |
| Source: Municipal Agriculture Office, 2014 | |||||||
Harvesting of rice usually takes when 80% of panicles turn to yellow in color. Cutting and filing were manually done through contract (pakyaw); daily (arawan) and percentage (honusan) system of sharing. But now, this system has change due to the trend of using harvesters. Axial flow rice thresher was usually used in 25 barangays with the total of 256 units. The decreased in the number of the rice thresher can be observed because of the trend of combine harvesters in the municipality as its advantage take by the farmers.
Rice were sold in form of palay (grain) or rice. Marginal farmers sold their palay to local market. Value will depend to grain quality. Dry season had a higher price compared to wet season, because post-harvest facilities like dryer is lacking during harvest season. Price range to Php 14.00 to Php 17.00/kilo during wet season and Php 14.00 to Php 18.00/kilo during dry season both at 18% to 26% moisture content (MC). Fancy and glutinous rice and good eating quality varieties are of much higher price compared to ordinary rice. Likewise, local traders and big land owners market their products in terms of rice outside the province of Oriental Mindoro. Some rice farmer sold their palay in the National Food Authority (NFA) at Barcenaga, Naujan, Oriental Mindoro buying satellite station, and in Calapan City with additional trucking fee.
B. Fruit Production
It can be recalled from Table 4.3 above that total production of fruits has decreased from 61,270 MT in 2013 to 43,165.73 MT in 2014, which can be attributed to extreme weather conditions and climate change that prevent the flowering trees to continue developing into fruits due to pests and diseases. Aside from this, production area decreased due to cutting down of old trees. In 2014, prevalence of mussel scale insect was noted in the upland barangays.
Lanzones has the biggest area of production in 2014 which occupied 1,666.56 has. It is worthy to note that in 2013, calamansi ranks second in terms of area of production and ranks first in terms of volume. A significant decrease in area of calamansi from 1,660.85 MT in 2013 to 884 has in 2014 was observed. Majority of the calamansi producers shifted or converted their calamansi farms to other crops or trees like mahogany. Despite the decrease in area, calamansi still ranked first in terms of volume of production in 2014 at 11,304.00. At present, Victoria is still the leading calamansi producer of Oriental Mindoro.
Comparative Fruit Production (MT), 2013 and 2014
| Major Crops | Area (Has.) | Volume of Production (MT) | ||||
| 2013 | 2014 | Increase/ Decrease | 2013 | 2014 | Increase/ Decrease | |
| Fruit Trees | 6,134.03 | 4,600.78 | (25.00) | 61,270.43 | 43,165.73 | (29.55) |
| Calamansi | 1,660.85 | 884.00 | (46.77) | 15,329.35 | 11,304.00 | (26.26) |
| Sintores | 605.50 | 604.56 | (0.16) | 6,986.00 | 7,216.00 | 3.29 |
| Rambutan | 966.50 | 987.12 | 2.13 | 10,411.00 | 8,986.00 | (13.69) |
| Lanzones | 1,897.00 | 1,666.56 | (12.15) | 11,919.58 | 8,032.73 | (32.61) |
| Durian | 886.75 | 337.50 | (61.94) | 14,579.50 | 5,343.00 | (63.35) |
| Mangosteen | 21.25 | 20.94 | (1.46) | 339.00 | 454.00 | 33.92 |
| Abiu | 40.50 | 43.10 | 6.42 | 283.00 | 260.00 | (8.13) |
| Mango | 55.68 | 57.00 | 2.37 | 1,423.00 | 1,570.00 | 10.33 |
Livestock and Poultry Production
The province of Oriental Mindoro is the primary source of calamansi in Luzon, particularly in the MIMAROPA Region. Ninety-two percent of the region’s calamansi area belongs to the province with almost 99 percent production output. A total of 7,325 has were planted with calamansi in 2011 with 104,416.27 MT production, based on Bureau of Agricultural Statistics (BAS) data. The average production volume per hectare is recorded at 17.46 MT, which surpassed the region’s average of 13.74 MT.
Among the 14 towns in Oriental Mindoro, it is the town of Victoria that contributes the highest calamansi production in terms of volume, number of hectares planted, and average productivity. Peak production reached 7,325.5 MT or 58.58% of the total production in the province. Moreover, the town had been reported to be having the highest average yield of 13.1 MT per hectare. The municipalities of Victoria, Calapan City, Pola, Socorro, and Naujan are the priority areas to focus investment on for the development of calamansi in the Priority Rural Development Program (PRDP) of the Provincial Government.
Despite these developments, some farmers opted to shift to other commodities and veered away from maintaining their calamansi farms because of oversupply of fresh produce during peak production periods which, in turn resulted in heavy post-harvest losses even as farmers get low prices for their products. The previous 3,000 has of calamansi farms gradually declined to only 884 hectares and is expected to further wane in the succeeding years. In view of this development, a proposal on revitalizing the calamansi industry in Victoria emerged. As such, Victoria will not only regain the status as the “Calamansi King”, but will afford better livelihood opportunities to the predominantly small upland farmers in the municipality. The proposal addresses the problems of the industry by providing potential solutions such as nursery establishment and maintenance of a demonstration farm for calamansi, regenerating existing farms, engaging in off-season production, and primary processing. Human capital formation activities geared towards various stakeholders are also envisioned. For farmer co-operators these include, among others, training on organizational, financial and marketing management, as well as conservation agriculture, climate smart technologies, and organic farming. Other stakeholders should also benefit from training on climate change adaptation, action research methodologies, value chain analysis and project development. Meanwhile, convergence meetings, investment fora, investor matching, and preparation of project feasibility studies are designed to strengthen external linkages, while process documentation and results based monitoring and evaluation will be the major cross-cutting activities of the project. The project is a collaborative undertaking among the local government of Victoria, the Mindoro State College of Agriculture and Technology (MinSCAT), and SEARCA with the guidance of other agencies such as the Department of Science and Technology (DOST), Department of Labor and Employment (DOLE), Department of Agriculture (DA), Department of Trade and Industry (DTI) and civil society organizations. The project’s total budgetary requirement for three years is PhP12,450,000.00.
Calamansi produced in the province are distributed outside the province in various drop points – Divisoria, Marikina, Batangas, Pasig, and Calamba. The retained volume are locally-consumed and processed into calamansi ready-to-mix by six village-level processors. For Victoria, Pakyas Rural Improvement Club (PARIC) is processing calamansi concentrate with its ready market not only in the municipality but also with other places such as outside the province. The local government of Victoria has also procured some processing equipment intended to be a shared service facility for calamansi processors through the assistance of the DOST. Ready market for calamansi juice produced by the LGU are the participants of its different activities, meetings and programs.
Table below shows the comparative fruit trees areas and production for two years. For citrus (Calamansi and Sintores), Bagong Silang has the highest area and production in 2013. In 2014, its production decreased but still this barangay produced the highest volume of citrus. Barangay Loyal has the highest volume of production of lanzones for 2013 with 2,080 MT the same on 2014 with 1, 614 MT.
Comparative Fruit Trees Areas and Production (MT), 2013 and 2014
| # | Barangay | Calamansi/Sintores | Lanzones | ||||||
| 2013 | 2014 | 2013 | 2014 | ||||||
| Area | Vol. | Area | Vol. | Area | Vol. | Area | Vol. | ||
| 1 | Alcate | 299.00 | 2,970.00 | 119.00 | 2,320.00 | 96.90 | 575.00 | 55.00 | 550.00 |
| 2 | Antonino | 106.00 | 1,566.00 | 98.00 | 1,466.10 | 114.13 | 1,141.50 | 114.15 | 1,014.00 |
| 3 | Bagong Buhay | 5.00 | 83.00 | 5.00 | 71.00 | 6.00 | 80.00 | 6.00 | 66.00 |
| 4 | Bagong Silang | 433.00 | 4,330.00 | 217.00 | 3,438.00 | 35.00 | 1,350.00 | 35.00 | 135.00 |
| 5 | Bambanin | 3.50 | 68.00 | 4.00 | 75.00 | 27.00 | 81.00 | 23.00 | 29.00 |
| 6 | Bethel | 98.00 | 980.00 | 98.00 | 985.00 | 25.00 | 250.00 | 25.00 | 25.00 |
| 7 | Canaan | 8.00 | 27.00 | 8.00 | 18.50 | 8.00 | 456.00 | 8.00 | 29.00 |
| 8 | Concepcion | 5.00 | 233.00 | 6.00 | 119.00 | 135.00 | 675.00 | 111.00 | 364.00 |
| 9 | Leido | 110.00 | 1,100.00 | 110.00 | 1,045.00 | 200.00 | 200.00 | 153.00 | 126.73 |
| 10 | Loyal | 308.00 | 2,728.00 | 214.00 | 2,553.40 | 260.00 | 2,080.00 | 244.00 | 1,614.00 |
| 11 | Merit | 5.00 | 21.00 | 6.00 | 6.00 | 40.00 | 120.00 | 36.00 | 41.00 |
| 12 | Ordovilla | 28.00 | 1,028.00 | 30.00 | 911.00 | 51.00 | 354.00 | 24.00 | 1,244.00 |
| 13 | Pakyas | 95.00 | 685.00 | 24.00 | 108.00 | 53.00 | 300.00 | 38.00 | 53.00 |
| 14 | Pob.3 | 14.50 | 21.00 | 3.00 | 14.00 | 5.00 | 15.00 | 5.00 | 29.00 |
| 15 | Sampaguita | 45.00 | 657.00 | 8.00 | 121.00 | 50.00 | 400.00 | 41.00 | 550.00 |
| 16 | San Antonio | 150.00 | 1,021.90 | 78.00 | 1,577.00 | 100.00 | 600.00 | 54.00 | |
| 17 | San Cristobal | 106.00 | 2,500.00 | 113.56 | 1,740.00 | 500.00 | 1,500.00 | 498.00 | 1,070.00 |
| 18 | San Isidro | - | 490.00 | - | 57.00 | - | - | - | 36.00 |
| 19 | San Gabriel | 205.00 | 1,685.00 | 167.00 | 1,801.00 | 146.00 | 1,339.00 | 157.41 | 546.00 |
| 20 | San Gelacio | 21.00 | 39.50 | 21.00 | 27.00 | 14.00 | 99.08 | 11.00 | 34.00 |
| 21 | San Narciso | 1.00 | 4.00 | 1.00 | 1.00 | 1.00 | 4.00 | 1.00 | |
| 22 | Villa Cerveza | 220.00 | 78.00 | 158.00 | 66.00 | 30.00 | 300.00 | 27.00 | 340.00 |
| Total | 2,266.00 | 22,315.40 | 1,488.56 | 18,520.00 | 1,897.00 | 11,919.58 | 1,666.56 | 8,032.73 | |
| Source: Municipal Agriculture Office, 2014 | |||||||||
The table below shows that San Gabriel has the highest production of rambutan in 2013 with 4,944 MT of production but in 2014 Ordovilla got its highest production of rambutan with 999 MT. Alcate has the highest production of other fruit trees such as durian, mango, abui and mangosteen both in 2013 and 2014.
Continuation of Comparative Fruit Trees Areas and Production (metric tons), 2013-2014
| # | Barangay | Rambutan | Others (Durian ,Mango, Abui, Mangosteen) | ||||||
| 2013 | 2014 | 2013 | 2014 | ||||||
| Area | Vol. | Area | Vol. | Area | Vol. | Area | Vol. | ||
| 1 | Alcate | 49.00 | 343.00 | 49.00 | 949.00 | 9.35 | 136.00 | 9.36 | 125.00 |
| 2 | Antonino | 79.00 | 632.00 | 79.00 | 579.00 | 8.25 | 178.00 | 8.25 | 167.00 |
| 3 | Bagong Buhay | 2.00 | 14.00 | 2.00 | 336.00 | 2.36 | 75.00 | 2.36 | 92.00 |
| 4 | Bagong Silang | 31.00 | 248.00 | 31.00 | 410.00 | 12.00 | 201.00 | 12.00 | 198.00 |
| 5 | Bambanin | 50.50 | 202.00 | 51.00 | 519.00 | 3.35 | 82.00 | 4.50 | 98.00 |
| 6 | Bethel | 17.50 | 140.00 | 17.50 | 170.00 | 2.67 | 77.00 | 2.67 | 69.00 |
| 7 | Canaan | 7.00 | 336.00 | 7.00 | 79.00 | 4.78 | 102.00 | - | - |
| 8 | Concepcion | 45.00 | 225.00 | 54.00 | 740.00 | 11.00 | 155.00 | 12.00 | 178.00 |
| 9 | Leido | 120.00 | 960.00 | 120.00 | 630.00 | 5.75 | 64.00 | 5.75 | 87.00 |
| 10 | Loyal | 30.00 | 240.00 | 30.00 | 720.00 | 9.00 | 247.00 | 9.00 | 276.00 |
| 11 | Macatoc | - | - | - | - | - | - | 2.18 | 43.00 |
| 12 | Merit | 25.00 | 25.00 | 27.00 | 287.00 | - | - | - | - |
| 13 | Ordovilla | 45.00 | 90.00 | 50.00 | 999.00 | 7.00 | 143.00 | 7.00 | 154.00 |
| 14 | Pakyas | 100.00 | 300.00 | 89.00 | 335.00 | 2.32 | 64.00 | 2.32 | 59.00 |
| 15 | Pob.3 | 2.00 | 8.00 | 2.00 | 21.00 | - | - | - | - |
| 16 | Sampaguita | 35.00 | 315.00 | 28.00 | 338.00 | 3.64 | 61.00 | 3.64 | 57.00 |
| 17 | San Antonio | 100.00 | 500.00 | 111.00 | 83.00 | 4.86 | 68.00 | 3.56 | 47.00 |
| 18 | San Cristobal | 50.00 | 250.00 | 50.00 | 620.00 | 6.35 | 75.00 | 6.35 | 97.00 |
| 19 | San Isidro | - | - | 11.00 | 65.00 | - | - | - | - |
| 20 | San Gabriel | 103.00 | 4,944.00 | 103.00 | 703.00 | 5.44 | 56.00 | 5.44 | 67.00 |
| 21 | San Gelacio | 15.00 | 337.50 | 15.00 | 23.00 | 3.00 | 4.00 | 3.00 | 6.00 |
| 22 | San Narciso | 0.50 | 1.50 | 0.50 | - | 0.75 | 20.00 | 1.00 | 32.00 |
| 23 | Villa Cerveza | 60.00 | 300.00 | 60.00 | 380.00 | 15.56 | 237.00 | 20.66 | |
| Total | 966.50 | 10,411.00 | 987.00 | 8.986.0 | 117.43 | 2,045.00 | 121.04 | 2,284.00 | |
C. Industrial Crops Production
Industrial crops are also inter-cropped with other fruit trees. Area of industrial crop production decreased from 1,372 has in 2013 to 1,230.54 in 2014 and volume of production consequently decreased by 9.93% While there is a significant increase in the volume of production of banana by 56%, there was a large decline in the production of coffee/cacao and coconut by 27.13% and 18.35%, respectively.
Comparative Agricultural Crop Areas and Production (metric tons), 2013 and 2014
| Major Crops | Area (has.) | Volume of Production (MT) | ||||
| 2013 | 2014 | Increase/ Decrease | 2013 | 2014 | Increase/ Decrease | |
| Industrial Crop | 1,372.00 | 1,230.54 | 10.31) | 2,560.88 | 2,306.68 | (9.93) |
| Coffee/cacao | 108.25 | 56.10 | (48.18) | 266.10 | 193.90 | (27.13) |
| Coconut | 777.75 | 689.94 | (11.29) | 1,443.78 | 1,178.78 | (18.35) |
| Banana | 435.00 | 440.80 | 1.33 | 788.00 | 836.00 | (6.09 |
| Pineapple | 51.00 | 43.70 | (14.31) | 63.00 | 98.00 | 55.56 |
| Source: Municipal Agriculture Office, 2014 | ||||||
Industrial crops as shown below are mostly found in Alcate. For the industrial areas and production, Brgy. Leido has the highest volume of coconut production for 2013 and 2014. While coffee/cacao were mostly produced in San Gabriel in two consecutive years.
Continuation Comparative Industrial Areas and Production (MT), 2013-2014
| # | Barangay | Banana | Pineapple | ||||||
| 2013 | 2014 | 2013 | 2014 | ||||||
| Area | Vol. | Area | Vol. | Area | Vol. | Area | Vol. | ||
| 1 | Alcate | 36.00 | 91.00 | 70.50 | 155.85 | 1.00 | 1.50 | 1.00 | 3.00 |
| 2 | Antonino | 35.00 | 85.00 | 26.50 | 33.65 | 2.00 | 2.50 | 2.00 | 4.50 |
| 3 | BagongBuhay | 33.00 | 68.00 | 14.00 | 7.50 | - | - | - | - |
| 4 | BagongSilang | 12.00 | 29.00 | 2.00 | 2.00 | 2.75 | 3.00 | 2.00 | 6.00 |
| 5 | Bambanin | 22.00 | 45.00 | 50.75 | 124.00 | 1.00 | 2.00 | 1.00 | 4.00 |
| 6 | Bethel | 11.00 | 22. 25 | 17.50 | 33.00 | - | - | - | - |
| 7 | Canaan | 25.00 | 38.00 | 25.00 | 31.00 | 2.00 | 3.00 | 2.00 | 5.50 |
| 8 | Concepcion | 35.00 | 83.00 | 30.00 | 77.00 | 0.25 | 1.00 | 0.25 | 2.00 |
| 9 | Leido | 21.00 | 58.00 | 1.50 | 2.50 | - | - | - | - |
| 10 | Loyal | 29.00 | 47.00 | 36.75 | 87.00 | 4.00 | 5.00 | 2.45 | 8.00 |
| 11 | Ordovilla | 38.50 | - | 30.00 | - | 13.00 | 9.00 | 11.00 | 13.00 |
| 12 | Pakyas | 12.50 | - | 15.00 | - | - | - | - | - |
| 13 | Sampaguita | 12.00 | 27.00 | 32.00 | 88.00 | 3.00 | 7.00 | 3.00 | 11.00 |
| 14 | San Antonio | 18.00 | 43.00 | 5.00 | 13.00 | 5.00 | 9.00 | 4.00 | 13.00 |
| 15 | San Cristobal | 36.00 | 89.00 | 45.80 | 123.50 | 4.00 | 7.50 | 4.00 | 9.50 |
| 16 | San Isidro | 13.00 | 18.00 | 10.50 | 13.00 | - | - | - | - |
| 17 | San Gabriel | 25.00 | 28.00 | 16.00 | 11.00 | 10.00 | 9.00 | 8.00 | 12.50 |
| 18 | San Gelacio | 13.00 | 27.00 | 5.00 | 16.00 | - | - | - | - |
| 19 | Villa Cerveza | 8.00 | 12.20 | 7.00 | 18.00 | 3.00 | 3.50 | 3.00 | 6.00 |
| Total | 435.00 | 788.00 | 440.80 | 836.00 | 51.00 | 63.00 | 43.70 | 98.00 | |
| Source: Municipal Agriculture Office, 2014 | |||||||||
Banana production has the largest area and production in Alcate, both for 2013 and 2014. Ordovilla and San Antonio both have the highest production of pineapple for two years.
Comparative Vegetable and Root Crops Areas and Production (MT), 2013-2014
| # | Barangay | Vegetable | Root Crops | |||||||
| 2013 | 2014 | 2013 | 2014 | |||||||
| Area | Vol. | Area | Vol. | Area | Vol. | Area | Vol. | |||
| 1 | Alcate | 56.00 | 356.00 | 58.00 | 325.00 | 65.00 | 450.00 | 78.00 | 350.00 | |
| 2 | Antonino | 0.50 | 9.00 | 0.50 | 8.00 | 0.50 | 10.00 | 5.50 | 5.00 | |
| 3 | Babangonan | 1.00 | 2.00 | 1.00 | 1.00 | - | - | - | - | |
| 4 | Bagong Buhay | 48.50 | 350.00 | 45.00 | 331.00 | 17.00 | 165.00 | 25.00 | 95.00 | |
| 5 | Bagong Silang | 1.50 | 35.00 | 1.50 | 20.00 | 2.50 | 30.00 | 5.50 | 25.00 | |
| 6 | Bambanin | - | - | - | - | 5.25 | 15.75 | 8.25 | 12.00 | |
| 7 | Bethel | 3.00 | 25.00 | 3.00 | 30.00 | - | - | - | - | |
| 8 | Canaan | 0.11 | - | 0.05 | - | - | - | - | - | |
| 9 | Concepcion | 0.25 | 1.00 | 0.50 | 2.00 | 4.50 | 14.50 | 8.05 | 5.00 | |
| 10 | Leido | 0.50 | 7.50 | 2.50 | 3.75 | 0.50 | 5.00 | 5.50 | 3.00 | |
| 11 | Loyal | - | - | - | - | 25.00 | 40.00 | 44.00 | 250.00 | |
| 12 | Malabo | 15.00 | 100.00 | 17.00 | 88.53 | 2.00 | 25.00 | 2.00 | 20.00 | |
| 13 | Ordovilla | 4.00 | 3.00 | 6.00 | 7.00 | 10.00 | 25.00 | 13.00 | - | |
| 14 | Pakyas | - | - | - | - | - | - | 10.00 | 30.00 | |
| 15 | Sampaguita | - | - | - | - | 4.00 | 8.00 | 14.00 | 8.00 | |
| 16 | San Antonio | 2.00 | 10.00 | 6.00 | 7.00 | 2.00 | 10.00 | 2.00 | 6.00 | |
| 17 | San Cristobal | 1.50 | 1.50 | 1.00 | 1.50 | 3.00 | 2.00 | 3.00 | 2.00 | |
| 18 | San Isidro | - | - | - | - | - | - | 9.45 | - | |
| 19 | San Gelacio | 2.00 | - | 5.00 | 9.00 | 0.50 | - | 5.50 | - | |
| 20 | San Narciso | 1.00 | 1.00 | 1.00 | 1.00 | 0.50 | 1.00 | 3.50 | 1.00 | |
| 21 | Villa Cerveza | 10.50 | 21.00 | 13.00 | 11.00 | 25.00 | 250.00 | 28.00 | 130.00 | |
| Total | 159.36 | 958.00 | 278.00 | 872.78 | 167.25 | 1,051.25 | 370.25 | 942.00 | ||
| Source: Municipal Agriculture Office, 2014 | ||||||||||
Aside from being the fruit basket of the province, Victoria has also known for its fertile soil, abundant water supply that the dwellers find it fit to engage in different enterprises such as backyard poultry raising and livestock raising. Both poultry and livestock can provide good income to the community.
Year 2006 marked the incipience of the Municipality’s new record in swine production when the town was recognized as one of Oriental Mindoro’s largest swine producers. This caught the attention of local government leaders to take advantage of this strength. The local government of Victoria promoted swine as its OTOP flagship project and prioritized the industry in its development plan.
The most basic project for the municipal government’s One Town One Product (OTOP) Program is swine production that includes breed upgrading and development. Considered as the municipality’s secondary source of livelihood, swine production has always been one of the major Agricultural Development Programs implemented through dispersal of high quality breeds, beneficiaries of this program are backyard hog raisers, mostly housewives, whose produce are usually consumed in the local market and whose income are marginal.
Existing Livestock and Poultry Farms, Year 2014
| Type | Barangay | Classification | Production | Market | |
| Volume | Value | ||||
| Livestock | |||||
| *Carabao | 32 | Farm | 1,037.00 | 31,110,000.00 | Other municipalities and provinces |
| *Cattle | 27 | Backyard | 667 | 20,010,000.00 | |
| *Swine | 32 | Backyard | 5,271.00 | 21,761,600.00 | |
| Poultry | |||||
| *Mallard Duck | 21 | Backyard | 4,486.00 | 44,860.00 | Local Market |
| *Broiler | 27 | Backyard | 5,151.00 | 1,236,240.00 | |
| Native Chicken | 32 | Backyard | 9,931.00 | 993,100.00 | |
| Game Fowl | 27 | Backyard | 1,786.00 | 267,900.00 | |
| Source: MAO | |||||
Services for artificial insemination on livestock production is being provided through the trained artificial insemination technician on a breeder animal like swine and large animals. The LGU purchases antibiotics, vitamins, dewormer, vaccines, and other biologics for the disease treatment and health maintenance.
To address the issues confronting the swine industry, Victoria’s Swine Industry Development Plan mantles major activities complementary to intensive swine production which include feed milling, breeding, fattening, manufacturing and processing aimed at cutting off production and maintenance cost, spurring opportunities for employment providing value-added benefits to the product, thereby increasing income of industry players.
Fisheries
Victoreños depend also on fisheries as livelihood. As some of the barangays were near on the Naujan Lake, they produced large number of fish production for local and export purposes with a great value. As the barangays of Victoria enjoy and share in the lakeshore resources, such as capture fisheries The figure below shows the Naujan Lake Fish Sanctuaries. Accordingly, there are a total of 14 species of fish observed within the lake. Of these fish species, the most dominant are tilapia, ayungin, and biya. Of the 14 species, five species are described as migratory fishes moving into the lake from the marine waters and include species such as bangus, banak, sinbad and two species of snapper. Freshwater shrimps are also present in the lake. As the fisher folks harvested those fishes, they transported it in the public market for source of income. Other products such as dried fish like biya and tilapia have been also brought in the public market and even in other municipalities.
The LGU is already protecting and managing lakeside habitat and enhancing fisheries management for poverty alleviation and hunger mitigation through establishment different projects that will give another sources of income in the municipality. Projects such as distribution of fingerlings, monitoring of installed fish cage and the lake management development through rehabilitation, monitoring and maintenance of existing buoy on fish sanctuaries, distribution of fishing gear paraphernalia, and maintenance of motor boat had been listed and implemented for the fisher folks.
Fishing Ground and River Aquaculture Production, Year 2014
| Fishing Ground /Sanctuaries | Barangay | Production | Market | |
| Inland | Volume MT | Value | Local Market | |
| 1. River | 18 barangays | 180 | 12,600,000.00 | |
| 2. Lake | Bambanin | 235 | 16,450,000.00 | |
| Doungan | 80 | 5,600,000.00 | ||
| Leido | 150 | 10,500,000.00 | ||
| Merit | 75 | 5,250,000.00 | ||
| Malabo | 175 | 12,250,000.00 | ||
| San Narciso | 50 | 3,500,000.00 | ||
| Urdaneta | 1.4 | 98,000.00 | ||
| 3. Fish Cages (River) | Bethel | 0.1 | 7,000.00 | |
| Pakyas | 1 | 70,000.00 | ||
| 4. Fishpond | 16 barangays | 3.31 | 231,700.00 | |
| Source: MAO | ||||
Source: Municipal Agriculture Office of Victoria, Oriental Mindoro
Municipalities

AGRICULTURAL FIESTA 2025 KICKS OFF ORIENTAL MINDORO’S 75TH FOUNDING ANNIVERSARY CELEBRATION

From Farm to Market: PAgO Trains Farmers on Ube Production and Enterprise Development

Oriental Mindoro Boosts Food Security with ₱2.258 Million Worth of Rice and Onion Seed Distribution

PAgO Empowers Farmer Organization through Leadership and Governance Training with Gender and Development
Subscribe to our AgriInfoHub newsletter and receive the latest updates, expert insights, and valuable tips to cultivate success on your farm.