AGRI-PROFILE: PINAMALAYAN,
ORIENTAL MINDORO
Pinamalayan, Oriental Mindoro
Pinamalayan is a first-class municipality located in the eastern part of the province of Oriental Mindoro, Mindoro Island. It is approximately 71 kilometers away from the provincial capital of Calapan City and 254 kilometers away from the national capital of Manila. Based on the certification by the Department of Environment and Natural Resources (DENR), it has an estimated total land area of 28,226 hectares comprised by 37 barangays. These are further classified into eight urban barangays and 29 rural barangays. Furthermore, there are ten coastal barangays. Among all the barangays, Sabang has the largest land area at 8,799.20 hectares while Zone IV has the smallest land area at 10.65 hectares.
According to the PSA, Pinamalayan has a total population of 86,172 with a growth rate of 1.03 percent. Total number of households is at 19,276 based on the CBMS Survey (2014). It is the most populous municipality after Calapan City and Naujan. Out of the 37 barangays, Marfrancisco is the most populous followed by Papandayan which is expected to be the most populous barangay in the coming years. The level of urbanization increased in the last 25 years. In 2000, 2010, and 2015, the urbanization level of Pinamalayan was higher than the provincial level.
Farming
The existing land use shows that about 16,904.2 hectares or 60% of the municipal land is utilized for various crops and fruit-bearing trees (Map Q). The top agricultural crops in terms of area utilization and annual production are as follows: rice, banana, coconut, fruit trees, and vegetables.
Over the course of history, agriculture is an important economic activity in the municipality. Furthermore, its crops have a product market that reaches up to the neighboring provinces of Cavite, Batangas, Marinduque and Romblon, as well as the national capital of Manila. It also has a market in the Visayas, particularly in Iloilo. The main cash crop is rice, for it has the greatest annual production and largest generated income.
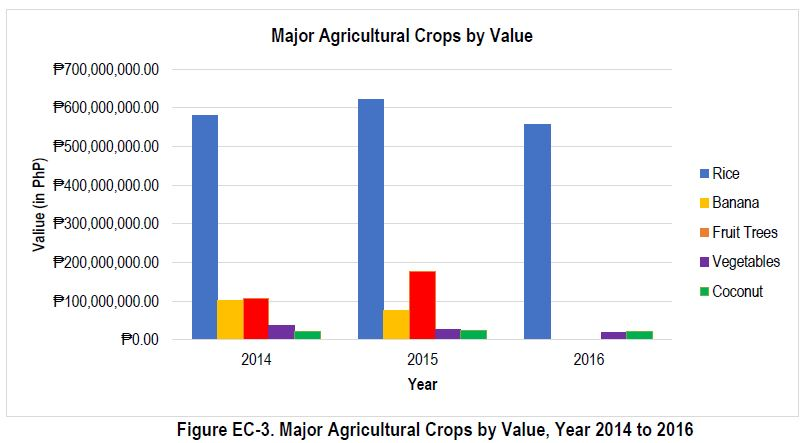
As summarized in the succeeding graphs, the general trend of area utilization (Figure EC-1), annual production (Figure EC-2), and annual generated values (Figure EC-3) have slightly increased in the years 2014 to 2015. However, all of the production volumes and generated revenues of major crops for the year 2016 have decreased drastically, compared to that of the 2014 and 2015 values.
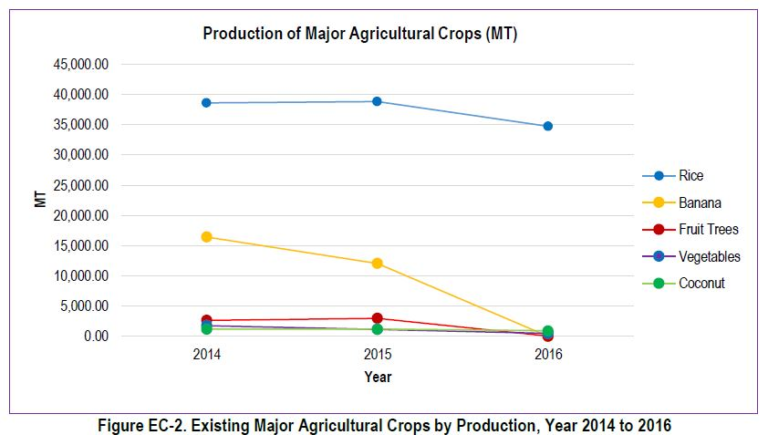
Furthermore, it is notable that the data on bananas were both of zero yield (Figure EC-2) and revenue in 2016 (Figure EC-3). This trend has been attributed to the heavy damages brought upon by Typhoon Nona which struck Pinamalayan in the latter part of 2015. Hence, the decrease in overall agricultural productivity in the following year of 2016 was observed. For the complete set of data, refer to Appendices D, E, and F.
According to interviews, one of the crops that has potential to be developed is the abaca or Manila Hemp. This plant is mostly grown on the higher elevations of the municipality but the trend cannot be observed because of the lack of data for the years 2014 to 2015. In 2016, the area utilized for such crop was at 86 hectares, with a yield of 15 metric tons and more than one million pesos in revenues.
Looking into the historical data for both agricultural land utilization and volume of production, an inverted relationship was observed between 2014 and 2015. While the total land utilization increased by 0.01 percent, production decreased by 7.42 percent (Table EC-1). Between 2015 to 2016, however, the decrease in agricultural areas and production became even more evident for there was a 7.79 percent decrease in area utilization and 35.66 percent decrease in production (Table EC-2). The results for each major crop is also shown in the said tables.
Table EC-1. Comparative Agricultural Crop Areas and Production, Year 2014 to 2015 Major Crops Area (hectares) Volume of Production
| Major Crops | Area (hectares) | Volume of Production (MT) | ||||
| 2014 | 2015 | % Increase/Decrease | 2014 | 2015 | % Increase/Decrease | |
| Rice | 7,883.50 | 7,946.00 | ↑0.79% | 38,615.98 | 38,876.78 | ↑0.68% |
| Banana | 2,346.51 | 2,325.64 | ↓0.04% | 16,442.79 | 12,064.04 | ↓26.63% |
| Fruit Trees | 643.26 | 581.32 | ↓9.63% | 2,658.81 | 2,977.47 | ↑11.99% |
| Vegetables | 121.07 | 143.07 | ↑18.18% | 1,758.17 | 1,146.42 | ↓34.79% |
| Coconut | 955.85 | 955.85 | 0.00% | 1,182.71 | 1,182.71 | 0.00% |
| TOTAL | 11,950.18 | 11,951.88 | ↑0.01% | 59,475.75 | 55,064.71 | ↓7.42% |
Source: Municipal Agriculture Office of Pinamalayan (2017), Philippine Coconut Authority (2017)
Table EC-2. Comparative Agricultural Areas and Production, Year 2015 to 2016
| Major Crops | Area (hectares) | Volume of Production (MT) | ||||
| 2014 | 2016 | % Increase/Decrease | 2014 | 2016 | % Increase/Decrease | |
| Rice | 7,946.00 | 7,494.82 | ↓5.68% | 38,876.78 | 34,771.29 | ↓10.56% |
| Banana | 2,325.64 | 2,186.04 | ↓6.00% | 12,064.04 | 0.00 | ↓100% |
| Fruit Trees | 581.32 | 474.96 | ↓18.30% | 2,977.00 | 13.89 | ↓99.53% |
| Vegetables | 143.07 | 120.36 | ↓15.87% | 1,146.42 | 493.60 | ↓56.94% |
| Coconut | 955.85 | 744.66 | ↓22.09% | 1,182.71 | 911.20 | ↓22.96% |
| TOTAL | 11,951.88 | 11,020.84 | ↓7.79% | 55,064.71 | 36,189.98 | ↓34.28% |
Source: Municipal Agriculture Office (2017), Philippine Coconut Authority (2017)
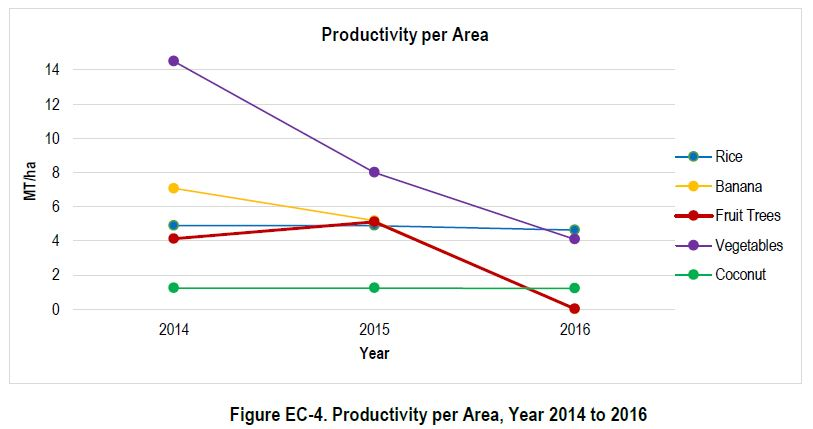
In 2014 and 2015, the greatest productivity per area were that of vegetables at 14.52 and 8.01 metric tons per hectare, respectively. While in 2016, rice had the most yield per area at 4.64 metric tons per hectare (Table EC-3).
But as displayed by Figure EC-4, the yield of coconuts and rice for the past three years has almost remained constant, while the yield for bananas, fruit trees, and vegetables have sharply decreased. All of these values, however, are showing declining productivity.
Table EC-2. Comparative Agricultural Areas and Production, Year 2015 to 2016
| Major Crops | 2014 | 2015 | 2016 |
|---|---|---|---|
| Rice | 4.90 | 4.89 | 4.64 |
| Banana | 7.07 | 5.19 | 0.00 |
| Fruit Trees | 4.13 | 5.12 | 0.03 |
| Vegetables | 14.52 | 8.01 | 4.10 |
| Coconut | 1.24 | 1.24 | 1.22 |
| Abaca | 0.12 |
Source: Municipal Agriculture Office (2017)
Increasing the land utilized for agriculture alone may not be a good strategy to increase overall agricultural production. Since typhoon occurrence is a major factor that can influence the level of production, it might be better to consider shifting cropping patterns combined with expanding land area for agricultural utilization. Since climate change is also expected to bring more hostile conditions for farming, sustainable production practices should also be supported, studied, and promoted. Availability of post-harvest facilities is of course given.
As of the 2014 CBMS, 20 percent of households are engaged in agriculture. Barangay Sabang has the largest percent share of households at 78 percent while the least percent share of households comes from barangays Wawa and Zone II, with both at one percent. Other pertinent data per barangay are presented by Table EC-4.
| Barangay | Number of Households | Households Engaged in Agriculture | |
| Number | Percent Share (%) | ||
| Anoling | 444 | 108 | 24% |
| Bacungan | 340 | 41 | 12% |
| Bangbang | 235 | 86 | 37% |
| Banilad | 457 | 153 | 33% |
| Buli | 331 | 109 | 33% |
| Cacawan | 1016 | 110 | 11% |
| Calingag | 456 | 151 | 33% |
| Del Razon | 375 | 52 | 14% |
| Guinhawa | 500 | 117 | 23% |
| Inclanay | 344 | 61 | 18% |
| Lumambayan | 658 | 32 | 5% |
| Malaya | 167 | 71 | 43% |
| Maliangcog | 339 | 125 | 37% |
| Maningcol | 418 | 95 | 23% |
| Marayos | 398 | 177 | 44% |
| Marfrancisco | 1,359 | 73 | 5% |
| Nabuslot | 604 | 124 | 21% |
| Pagalagala | 307 | 76 | 25% |
| Palayan | 421 | 82 | 19% |
| Pambisan Malaki | 413 | 123 | 30% |
| Pambisan Munti | 254 | 98 | 39% |
| Panggulayan | 586 | 126 | 22% |
| Papandayan | 1,338 | 93 | 7% |
| Pili | 800 | 203 | 25% |
| Quinabigan | 502 | 58 | 12% |
| Ranzo | 225 | 79 | 35% |
| Rosario | 353 | 42 | 12% |
| Sabang | 686 | 532 | 78% |
| Sta. Isabel | 570 | 246 | 43% |
| Sta. Maria | 321 | 90 | 28% |
| Sta. Rita | 674 | 118 | 18% |
| Sto. Niño | 274 | 39 | 14% |
| Wawa | 1123 | 10 | 1% |
| Zone I | 680 | 15 | 2% |
| Zone II | 625 | 8 | 1% |
| Zone III | 475 | 28 | 6% |
| Zone IV | 208 | 45 | 22% |
| TOTAL | 19,276 | 3,796 | 20% |
Source: CBMS Survey (2014)
Table EC-5 shows a summary of the water irrigation system present in the municipality. The NIA-Pula-Bansud River Irrigation System (RIS) has been operating since 1960. Since then, several rehabilitation works were taken through the Irrigation Operation Support Project (IOSP). It diverts the water through a run-off type river dam located across the Pula River in barangay Inclanay. The system currently serves 18 barangays in Pinamalayan, two in Socorro, and another two in Pola. It is also reported that the existing irrigation facilities inadequately supplies water in some areas, resulting to adverse effects in production. Thus, it is recommended that canals should be rehabilitated, as well as to concretize existing farm ditch canals. See Appendix G for the irrigation map from NIA.
Table EC-5. Water Irrigation System
| Irrigation System | Date Constructed | Type of Ownership | Type of Irrigation | Type of Capacity of Irrigation System (m3/day) | Type of Location (Barangay) |
|---|---|---|---|---|---|
| Pula RIS | December 15, 1960 | Public | Diversion Dam and Checkgate | 324,000 | Inclanay |
According to GIS estimations, there is 948.60 hectares of mixed agricultural areas with irrigation canals (Maps R). This was done by overlaying the existing mixed agricultural areas against the irrigation system, with 50 meters buffer area on each side of the canals. This means that these lands can be further developed into rice production areas. The summary of areas per barangay is shown by Table EC-6. The largest area coverage is at barangay Pambisan Malaki with 157.83 hectares while the smallest area coverage is at barangay Zone I with 0.29 hectares.
Table EC-6. Mixed Agricultural Areas with Irrigation, Year 2017
| Barangay | Mixed agricultural areas with irrigation (ha) |
|---|---|
| Anoling | 53.95 |
| Bacungan | 85.59 |
| Bangbang | 57.43 |
| Buli | 1.11 |
| Cacawan | 12.41 |
| Calingag | 53.02 |
| Inclanay | 29.51 |
| Maningcol | 33.00 |
| Marfrancisco | 20.76 |
| Nabuslot | 85.14 |
| Pagalagala | 60.83 |
| Palayan | 28.66 |
| Pambisan Malaki | 157.83 |
| Panggulayan | 49.49 |
| Papandayan | 74.83 |
| Rosario | 6.82 |
| Sta. Maria | 64.06 |
| Sta. Rita | 30.24 |
| Sto. Nino | 43.63 |
| Zone I | 0.29 |
| TOTAL | 948.60 |
Agricultural Support Facilities
In 2016, the number of agricultural support facilities has a total of 1,665 units. However, Table EC-7 shows a decline in the number of these facilities from 2014 to 2016. The most common farm equipments used in the municipality are tractors, threshers, blowers, rice mills, and combine harvesters. Most of these are 100 percent utilized and are operational, except for some units of rice mills. Further information regarding other facilities are shown in the said table.
Some problems were also raised regarding these support facilities. First is the absence of an existing ordinance to regulate the usage of mechanical dryers for rice. Moreover, attention should also be given to the lack of facilities for post-harvest handling, processing, as well as preservation of agricultural produce. This is essential to be able to ensure longer shelf life, quality, and fair pricing. This is needed especially during the times of excess supply and this can also give farmers more income options.
In addition, there is one public market located at the Poblacion which currently has a functional area of 1,508.70 square meters and has 165 stalls. This serves as the center where all kinds of produce throughout the municipality are being traded and sold.
Table EC-7. Existing Agricutural Support Facilities and Services, Year 2014 to 2016
| Agricultural support facility | No. | % Utilization | Type/Capacity | Remarks (operational or not; needs repair) |
| Year 2014 | ||||
| Rice mill | 44 | 89% | 25 single pass; 19 single and multi-pass | Mostly operational; 5 units not operational |
| Multi-purpose drying pavement/solar dryer | 210 | 100% | 10-40 cavans | Operational |
| Market center | 1 | 100% | 1,508.70 sq.m. (165 stalls) | Operational |
| Hand tractor | 580 | 100% | 1.0 hectares/day | Operational |
| Private thresher | 427 | 100% | 1.5 hectares/day | Operational |
| Blower | 427 | 100% | 1.5 hectares/day | Operational |
| Combine harvester | 7 | 100% | 1.5 hectares/day | Operational |
| Four-wheel mini tractor | 1 | 100% | 3.0 hectares/day | Operational |
| Sub Total | 2,277 | |||
| Year 2015 | ||||
| Rice mill | 45 | 91% | 25 single pass; 20 single and multi-pass | Mostly operational; 4 units not operational |
| Multi-purpose drying pavement/solar dryer | 210 | 100% | 10-40 cavans | Operational |
| Market center | 1 | 100% | 1,508.70 sq.m. (165 stalls) | Operational |
| Hand tractor | 580 | 100% | 1.0 hectares/day | Operational |
| Private thresher | 427 | 100% | 1.5 hectares/day | Operational |
| Blower | 427 | 100% | 1.5 hectares/day | Operational |
| Combine harvester | 7 | 100% | 1.5 hectares/day | Operational |
| Four-wheel mini tractor | 4 | 100% | 3.0 hectares/day | Operational |
| Sub Total | 1,701 | |||
| Year 2016 | ||||
| Rice mill | 47 | 89% | 30 single pass; 17 single and muti-pass | Mostly operational; 5 units not operational |
| Multi-purpose drying pavement/solar dryer | 210 | 100% | 10-40 cavans | Operational |
| Market center | 1 | 100% | 1,508.70 sq.m. (165 stalls) | Operational |
| Hand Tractor | 584 | 100% | 1.0 hectares/day | Operational |
| Private thresher | 398 | 100% | 1.5 hectares/day | Operational |
| Blower | 398 | 100% | 1.5 hectares/day | Operational |
| Combine Harvester | 20 | 100% | 1.5 hectares/day | Operational |
| Four-wheel mini tractor | 7 | 100% | 3.0 hectares/day | Operational |
| Sub Total | 1,665 | |||
| TOTAL | 5,643 | |||
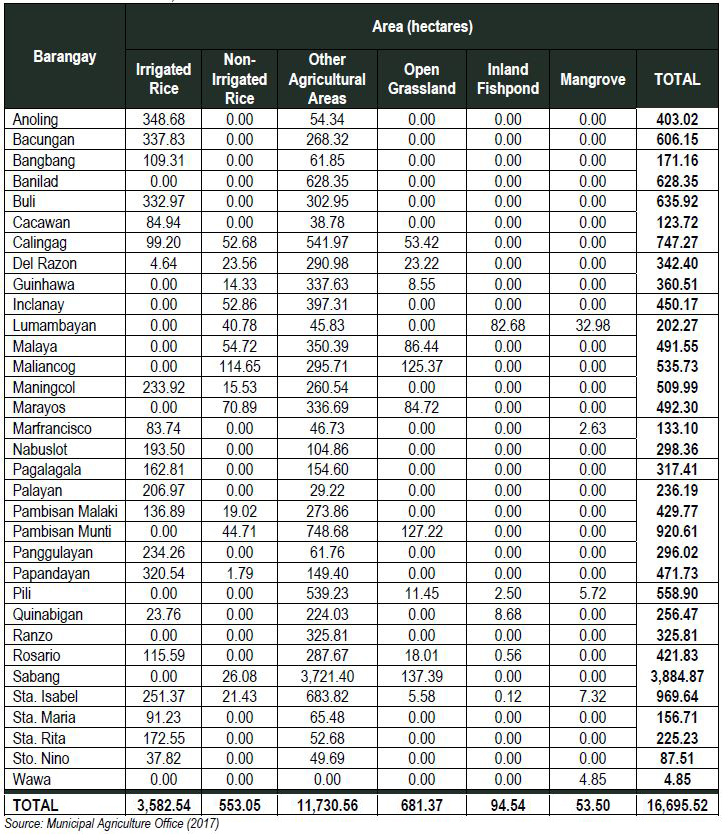
The Strategic Agriculture and Fisheries Development Zone or SAFDZ areas comprise about 16,695.52 hectares in total, or 59 percent of the total land area of Pinamalayan (Map Q). These are made up of areas utilized for irrigated rice, non-irrigated rice, inland fishponds, mangroves, open grasslands, and other agricultural areas. Furthermore, the other agricultural areas are used mainly for planting of fruit-bearing trees such as coconuts and bananas, among others.
Barangay Sabang has the most number of lands utilized for SAFDZ with a total area of around 3,884.87 hectares while barangay Wawa has the least area with a total of 4.85 hectares. The land utilization per barangay is shown in Table EC-8.
Table EC-8. SAFDZ Areas, Year 2017
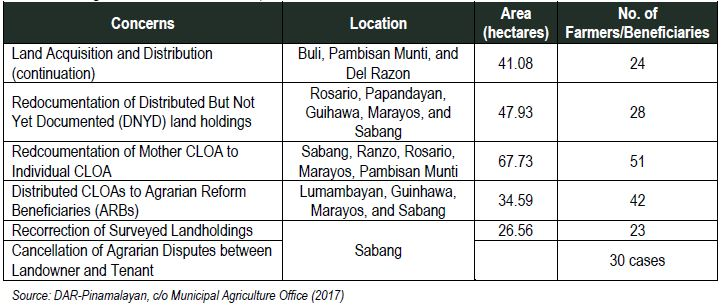
A total of 2,291.10 hectares of Comprehensive Agrarian Reform Program (CARP) Areas were distributed throughout the municipality and these are found in 31 barangays (Map S). However, it was found out that some of these CARP lands, with a total of 1,090 hectares, are situated in areas with equal to or greater than 18 percent slope as well as in forestlands. Approximately 777 hectares are located in areas with 18 percent slope and above while 310 hectares are present within forestlands. These identified areas are located in the barangays of Sabang, Marayos, Inclanay, Maliancog, Calingag, Rosario, Maningcol, Malaya, Buli, Sta. Isabel, Guinhawa, Pili, Banilad, and Ranzo.
There was a total of six agrarian related concerns raised during the years of 2014 to 2016. These dealt with land acquisitions and distribution, redocumentation of distributed land holdings, correction of surveyed lands, and cancellation of agrarian disputes. These are further summarized in Table EC-10, along with the location, beneficiaries, and extent of area concerned.
Table EC-9. Agrarian Related Concerns, Year 2014 to 2016
LIVESTOCK RAISING
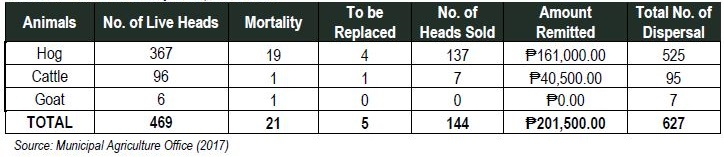
Based on the animal dispersal data of 2015 (Table EC-10), there was a total of 469 live heads of livestock. Hogs are the most common animals raised with 367 live heads, followed by cattle with 96 live heads, and goats with 6 live heads. It is also noteworthy that goats did not generate any income because these are mostly for backyard or subsistence consumption only.
Table EC-10. Animal Dispersal, Year 2015
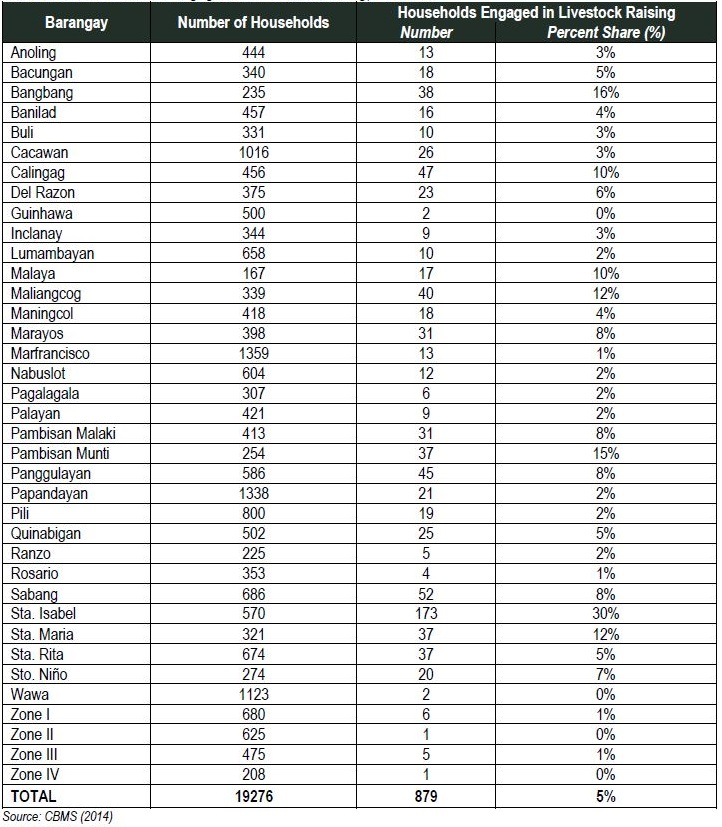
The results of the 2014 CBMS shows that five percent of households are engaged in livestock raising. Most of these households are from barangay Sta. Isabel with a total of 173 households while barangays Zone II and Zone IV both only have one household involved with such activity. More data per barangay is displayed by Table EC-11.
Table EC-11. Households Engaged in Livestock Raising, Year 2014
FISHERIES
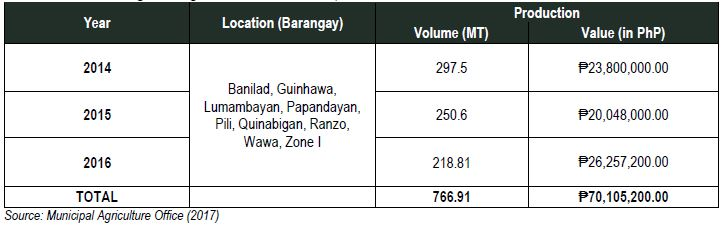
Regarding fisheries, there is a total of 766.91 metric tons of fish catches from 2014 to 2016 in nine coastal barangays. However, it can be observed in Table EC-12 that the annual volume of fish catches is steadily declining for the past three years, from 297.5 metric tons in 2014 to 218.81 metric tons in 2016. However, the value shows fluctuations for it dropped in 2015 to 20 million pesos from 23 million pesos, and then rose to 26 million in 2016. This can be attributed to the declining fish catches that resulted to higher prices.
Table EC-12. Existing Fishing Grounds Production, Year 2014 to 2016
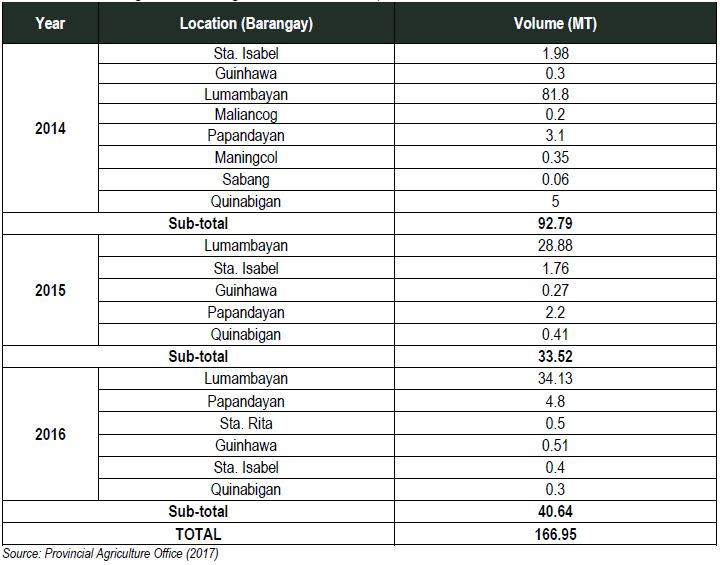
The inland fishing data also shows fluctuations in its production, as seen in Table EC-13. The year 2014 had a production volume of 92.79 metric tons and this was reduced heavily in the year 2015 at 33.52 metric tons, probably because there were less barangays engaged in inland fishing compared to that of 2014. But in the year 2016, production grew to 40.64 metric tons. For the past three years, the total volume is at 293.26 metric tons. There is no available data regarding the monetary value.
Existing Inland Fishing Grounds Production, Year 2014 to 2016
Regarding fish catches in general, the data is showing continuous decline in production for three consecutive years. From 2014 to 2015, the combined volume of production from marine and inland sources decreased by 15 percent. In the succeeding year, a 12 percent decrease in production was derived. As to generated gross income that corresponds to volume of production in the same observed years, it was noted that from 2014 to 2015, the gross income per metric tons was maintained at 80,000 pesos. This shows steady market value despite 15 percent decrease in production. Aside from climate change, some problems have also been identified that have exacerbated the worsening fisheries production through the years. For example, fishing during spawning seasons is prevalent, as well as the practice of illegal fishing such as using fine-meshed nets and poaching of endangered species.
However, from 2015 to 2016 where there is 26.45 percent decrease in fish production from 2014, it was noted that the value of fish per metric tons rose to 120,000 pesos. This result indicates that the invisible hand manipulating the market price is already working at this time. Thus, the law of supply and demand already applies. As the supply decreases with increasing demand or even at constant demand, the commodity price increases. Hence, if declining fish production persists in the succeeding years, a possible scenario would be the market price for fish may not be affordable for low income groups or may be hardly affordable for middle income groups.
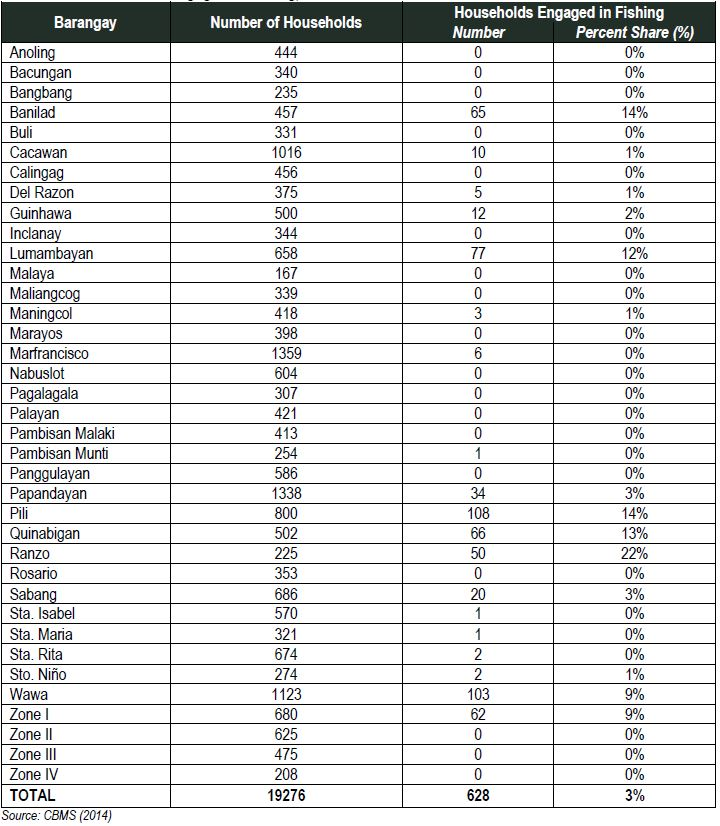
A total of 628 households or three percent of the total are engaged in fishing activities. These households are mostly coming from the nine coastal barangays of the municipality. Barangay Ranzo has the largest percent share of households at 22 percent. Fisherfolk are also affected by the unsustainability of fishing activities through the years. This situation calls for allocation of alternative livelihood for the affected population. Data regarding households engaged in fishing per barangay are further shown in Table EC-14.
Households engaged in Fishing, Year 2014
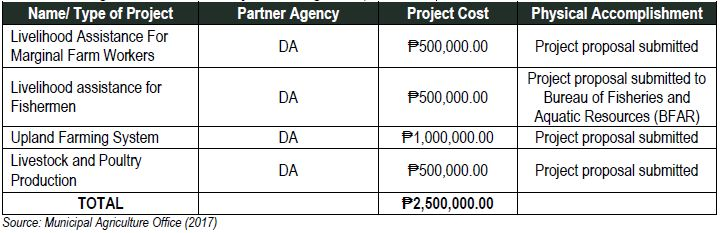
In 2015, a total of 2.5 million pesos was spent for agriculture related projects as stated by Table EC-15. These provided livelihood assistance for marginal farm workers and fishermen. Furthermore, these were utilized for upland farming system as well as livestock and poultry production. For these projects, the listed physical accomplishments were mostly project proposals that were submitted. Moreover, all of these projects were in partnership with the Department of Agriculture (DA).
Table EC-15. Agriculture Related Projects through GPB, Year 2015 Agriculture Related Projects through GPB, Year 2015
Municipalities

AGRICULTURAL FIESTA 2025 KICKS OFF ORIENTAL MINDORO’S 75TH FOUNDING ANNIVERSARY CELEBRATION

From Farm to Market: PAgO Trains Farmers on Ube Production and Enterprise Development

Oriental Mindoro Boosts Food Security with ₱2.258 Million Worth of Rice and Onion Seed Distribution

PAgO Empowers Farmer Organization through Leadership and Governance Training with Gender and Development
Subscribe to our AgriInfoHub newsletter and receive the latest updates, expert insights, and valuable tips to cultivate success on your farm.