AGRI-PROFILE: SOCORRO, ORIENTAL MINDORO
Socorro, Oriental Mindoro
The Municipality of Socorro is an Agriculture-Based community. Farming is the main economic activity with 10,698.60 hectares devoted to crop production (Table 5.1). The area planted to forest species decreased from 105.75 has. in 2008 to 92.43 has in 2010. In contrast, the livestock and poultry area increased from 3.5 has in 2008 to 9.1 has in 2010. The total land area devoted to agricultural production is 59.03% of the municipal land area.
Comparative Area Utilization of Significant Agricultural Activities
| Activities | 2008 | 2009 | 2010 | |||
| Area | % | Area | % | Area | % | |
| Crop Production | 8,550.54 | 98.67 | 10,766 | 99.1 | 10,591.69 | 99 |
| Livestock/Poultry | 3.5 | 0.04 | 4.35 | 0.04 | 9.1 | 0.09 |
| Fishing | 5.9 | 0.07 | 6.2 | 0.06 | 5.375 | 0.05 |
| Forest Product | 105.75 | 1.22 | 87.53 | 0.8 | 92.43 | 0.86 |
| Total | 8,665.69 | 100 | 10,864.08 | 100 | 10,698.60 | 100 |
| Source: Municipal Agriculturist's Office, 2011 | ||||||
Agricultural Crops
A. Rice Production
Rice production area consist of 2,439 hectares, 82.16% or 2004 has. of which is irrigated and 17.84% or 435 has. is utilized for non-irrigated or rainfed rice production.
Area, Production and Value of Production of Palay, 2011
| Rice Production | Area (hectares) | % to Total Land Area Devoted to Rice Production | Production | Prod. Market | ||
| Total (MT) | Value of Production (P) | Local | Export | |||
| Irrigated | 2004 | 82.16 | 15,225.55 | 190,318.76 | ||
| Non-Irrigated (Rainfed) | 435 | 17.84 | 3,044.20 | 38,072.50 | ||
| Total | 2,439 | 100 | 18,269.75 | 228,391.260 | ||
| Source: Municipal Agriculturist's Office | ||||||
Eighteen (18) of the 26 Barangays in Socorro are producing rice. Of these, Matungao has the highest in terms of hectarage and volume of production, whereas Catiningan has the smallest area and volume of production.
Most farmers practice the semi-mechanized system of rice farming. Land preparations are made using small farm machinery and draft animals. Harvesting is commonly manual, either on per day or “pakyaw” basis. Threshing is done using threshers or sometimes combined harvesting while drying is either sun drying or mechanical drying.
Many farmers cannot afford to buy certified seeds resulting to inferior crop production low yield (3.8MT/ha. on the average). Good thing there is a government seeds subsidy program that greatly helped a lot of farmers. This subsidy program is the Community Seed Banking (CSB) program which is in the form of registered seed serving as multiplier seeds for Irrigator’s Association (IAs).
Area, Yield and Value of Production and No. of Farmers in Palay Production Per Barangay, 2011
| Barangay | Area | Yield(MT) | Value of Production (P) | No. of Farmers | ||||||||
| Irrigated | Rainfed | Total | Irrigated | Rainfed | Total | Irrigated | Rainfed | Total | Irrigated | Rainfed | Total | |
| Bagsok | 170.25 | 170.25 | 1,178.14 | 1,178.14 | 14,726.75 | 14,726.75 | 68 | 68 | ||||
| Batong | 12 | 12 | 82.80 | 82.80 | 1,035.00 | 1,035.00 | 9 | 9 | ||||
| Bayuin | 224.75 | 224.75 | 1,708.10 | 1,708.10 | 21,351.25 | 21,351.25 | 141 | 141 | ||||
| Bugtong na Tuog | ||||||||||||
| Calocmoy | 313.25 | 313.25 | 2,380.70 | 2,380.70 | 29,758.75 | 29,758.75 | 152 | 152 | ||||
| Calubayan | 145.00 | 145.00 | 1,102.00 | 1,102.00 | 13,775.00 | 13,775.00 | 103 | 103 | ||||
| Catiningan | 12.50 | 12.50 | 86.24 | 86.24 | 1,078.00 | 1,078.00 | 6 | 6 | ||||
| Fortuna | 22.00 | 22.00 | 195.00 | 195.0 | 2,437.50 | 2,437.50 | 17 | 17 | ||||
| Happy Valley | ||||||||||||
| Leuteboro I | 383.00 | 383.00 | 2,926.12 | 2,926.12 | 36,576.50 | 36,576.50 | 132 | 132 | ||||
| Leuteboro II | 135.00 | 135.0 | 1,034.10 | 1,034.10 | 12,926.25 | 12,926.25 | 64 | 64 | ||||
| Ma. Concepcion | ||||||||||||
| Mabuhay I | 36.00 | 36.00 | 246.24 | 246.24 | 3,078.00 | 3,078.00 | 33 | 33 | ||||
| Mabuhay II | 34.75 | 34.75 | 236.98 | 236.98 | 2,962.25 | 2,962.25 | 38 | 38 | ||||
| Malugay | 60.00 | 60.00 | 458.40 | 458.40 | 5,730.00 | 5,730.00 | 40 | 40 | ||||
| Matungao | 506.00 | 506.00 | 3,896.20 | 3,896.20 | 48,702.50 | 48,702.50 | 224 | 224 | ||||
| Monteverde | 107.00 | 107.00 | 731.88 | 731.88 | 9,148.50 | 9,148.50 | 75 | 75 | ||||
| Pasi I | 19.00 | 19.00 | 129.58 | 129.58 | 1,619.75 | 1,619.75 | 12 | 12 | ||||
| Pasi II | ||||||||||||
| Sto. Domingo | 128.50 | 128.50 | 889.22 | 889.22 | 11,135.25 | 11,135.25 | 58 | 58 | ||||
| Subaan | 91.00 | 91.00 | 691.60 | 691.60 | 8,645.00 | 8,645.00 | 53 | 53 | ||||
| Villareal | 39.00 | 39.00 | 296.40 | 296.40 | 3,705.00 | 3,705.00 | 25 | 25 | ||||
| Zone I | ||||||||||||
| Zone II | ||||||||||||
| Zone III | ||||||||||||
| Zone IV | ||||||||||||
| TOTAL | 2,004.00 | 435.00 | 2,439.00 | 15,225.50 | 3,044.20 | 18,269.70 | 190,318.75 | 38,072.50 | 228,391.25 | 1,009.00 | 241.00 | 1,250.00 |
| Source: Municipal Agriculturist's Office, 2011 | ||||||||||||
B. Fruit Crop Production
In terms of fruit crop/permanent crop, coconut has the highest hectarage with 2,262.57 has. planted with a production of 7,640.58 MT. Although banana ranked 2nd with 2,145.9 has. it has the highest volume of production with 18,853.98MT (Table 5.1.1B). This fact is attributed to the frequency of harvest cycle. Production of other fruit tree species has become unpredictable due to its seasonality and climate change.
Area (has.) Devoted to Fruit and Industrial Crop Production Per Barangay, 2011
| Barangay | Fruit/Industrial Crop | TOTAL | |||||||||
| Banana | Citrus | Rambutan | Lanzones | Durian | Mangosteen | Mango | Guyabano | Coconut | Abaca | ||
| Bagsok | 32.58 | 50.83 | 1.39 | 10.75 | 3.39 | 0.23 | 9.00 | 94.00 | 211.17 | ||
| Batong | 10.97 | 5.00 | 15.25 | 5.45 | 0.78 | 0.43 | 136.30 | 174.18 | |||
| Bayuin | 50.22 | 154.33 | 19.73 | 19.26 | 0.07 | 16.00 | 117.09 | 376.70 | |||
| Bugtong na Tuog | 7.52 | 3.32 | 1.65 | 5.64 | 0.23 | 9.25 | 30.16 | 2.50 | 60.27 | ||
| Calocmoy | 16.42 | 5.21 | 1.36 | 3.62 | 0.39 | 15.11 | 112.60 | 154.71 | |||
| Calubayan | 111.17 | 150.41 | 50.78 | 70.34 | 0.78 | 0.70 | 5.75 | 42.60 | 432.53 | ||
| Catiningan | 177.84 | 33.81 | 5.00 | 8.43 | 128.97 | 354.05 | |||||
| Fortuna | 1,028.60 | 107.06 | 140.89 | 41.31 | 3.65 | 9.50 | 0.30 | 117.58 | 12.00 | 1,460.89 | |
| Happy Valley | 163.18 | 13.14 | 101.75 | 85.50 | 2.38 | 0.05 | 12.60 | 1.25 | 220.89 | 600.74 | |
| Leuteboro I | 13.71 | 2.50 | 2.39 | 2.17 | 8.20 | 17.31 | 46.28 | ||||
| Leuteboro II | 31.85 | 15.34 | 3.63 | 1.75 | 2.30 | 215.49 | 270.36 | ||||
| Ma. Concepcion | 16.42 | 25.00 | 34.63 | 38.74 | 1.95 | 23.20 | 0.78 | 83.15 | 223.86 | ||
| Mabuhay I | 52.61 | 116.21 | 100.00 | 100.25 | 5.23 | 11.00 | 30.82 | 416.12 | |||
| Mabuhay II | 11.10 | 356.00 | 32.34 | 28.50 | 0.39 | 23.00 | 0.67 | 86.28 | 538.28 | ||
| Malugay | 125.35 | 56.00 | 21.28 | 71.28 | 3.98 | 7.69 | 16.00 | 1.03 | 63.20 | 365.81 | |
| Matungao | 63.14 | 15.24 | 11.32 | 39.82 | 0.15 | 8.60 | 200.38 | 338.65 | |||
| Monteverde | 102.28 | 340.00 | 51.56 | 48.50 | 0.78 | 7.26 | 0.63 | 100.32 | 651.33 | ||
| Pasi I | 3.42 | 34.23 | 14.25 | 7.50 | 0.31 | 2.53 | 22.71 | 84.95 | |||
| Pasi II | 8.72 | 13.31 | 11.17 | 15.25 | 0.25 | 1.60 | 23.79 | 74.09 | |||
| Sto. Domingo | 18.73 | 133.25 | 14.10 | 37.68 | 0.97 | 68.81 | 273.54 | ||||
| Subaan | 12.43 | 298.00 | 12.00 | 58.25 | 3.46 | 5.75 | 0.86 | 200.49 | 591.24 | ||
| Villareal | 71.00 | 30.97 | 126.14 | 50.12 | 0.07 | 12.30 | 0.35 | 120.89 | 411.84 | ||
| Zone I | 1.00 | 0.31 | 0.33 | 2.00 | 3.64 | ||||||
| Zone II | 5.07 | 4.00 | 1.00 | 0.07 | 4.95 | 15.09 | |||||
| Zone III | 11.57 | 2.02 | 0.06 | 1.00 | 0.43 | 21.60 | 36.68 | ||||
| Zone IV | 0.19 | 0.19 | |||||||||
| TOTAL | 2,145.90 | 1,966.18 | 777.97 | 747.75 | 29.21 | 8.67 | 208.57 | 5.87 | 2,262.57 | 14.50 | 8,167.19 |
| Source: Municipal Agriculturist's Office, 2011 | |||||||||||
Vegetable production areas are generally located in the barangays of Bagsok, Calocmoy, Subaan, Bayuin, Malugay and Villareal (Table 5.1.1C). The species ranges from “Pakbet” type to leafy vegetables (mustard and pechay) along with mongo, sitao, upo and patola. Vegetable produce are commonly sold at neighboring towns of Pinamalayan and Victoria aside from domestic consumption.
Volume of Vegetable Production Per barangay/Vegetable Type (MT), 2011
| Barangay | Vegetable | |||||||||
| Mustard | Pechay | Eggplant | Okra | Squash | Ampalaya | Mongo | Sitao | Patola | Upo | |
| Bagsok | 0.638 | 0.180 | 0.624 | 0.150 | 0.390 | 0.810 | 0.080 | 0.072 | ||
| Batong | 0.360 | 0.110 | 0.132 | 0.036 | ||||||
| Bayuin | 0.252 | 0.011 | 0.510 | 0.360 | 0.495 | 0.550 | 0.015 | 0.016 | ||
| Bugtong na Tuog | 0.027 | 0.026 | 0.009 | |||||||
| Calocmoy | 0.242 | 0.398 | 0.768 | 0.126 | 0.494 | 0.238 | 0.683 | 0.231 | ||
| Calubayan | 0.183 | 0.080 | 0.115 | 0.018 | 0.243 | 0.253 | ||||
| Catiningan | 0.162 | 0.313 | 0.158 | |||||||
| Fortuna | 0.012 | 0.052 | 0.168 | 0.025 | 0.013 | 0.149 | 0.013 | |||
| Happy Valley | 0.135 | 0.108 | ||||||||
| Leuteboro I | 0.144 | 0.452 | 0.400 | 0.173 | ||||||
| Leuteboro II | 0.078 | 0.204 | 0.356 | 0.360 | 0.020 | |||||
| Ma. Concepcion | 0.085 | 0.032 | ||||||||
| Mabuhay I | 0.182 | 0.011 | 0.020 | |||||||
| Mabuhay II | 0.103 | |||||||||
| Malugay | 0.245 | 0.420 | 0.464 | 0.480 | 0.245 | 0.249 | ||||
| Matungao | 0.306 | 0.360 | 0.314 | 0.095 | ||||||
| Monteverde | 0.182 | 0.248 | 0.338 | 0.370 | 0.076 | |||||
| Pasi I | 0.008 | 0.016 | 0.011 | 0.014 | ||||||
| Pasi II | 0.168 | 0.064 | ||||||||
| Sto. Domingo | 0.109 | 0.012 | 0.034 | 0.224 | 0.130 | |||||
| Subaan | 0.203 | 0.271 | 0.729 | 0.234 | 0.422 | 0.527 | 0.050 | 0.336 | 0.104 | |
| Villareal | 0.237 | 0.252 | 0.754 | 0.884 | 0.545 | 0.061 | ||||
| Zone I | ||||||||||
| Zone II | 0.016 | |||||||||
| Zone III | 0.016 | |||||||||
| Zone IV | ||||||||||
| TOTAL | 1,899 | 2,241 | 4,254 | 1,787 | 4,572 | 4,092 | 2,206 | 3,136 | 0.213 | 0.289 |
| Source: Municipal Agriculturist's Office, 2011 | ||||||||||
D. Rootcrop Production
Scattered and compact planting of rootcrops are found in the rural barangays of the municipality. Mostly grown is gabi while cassava, camote and ubi are grown in some barangays.
Volume of Rootcrops Production Per Barangay (MT), 2011
| Barangay | Rootcrop | TOTAL | |||
| Cassava | Camote | Ube | Gab | ||
| Bagsok | .0398 | 0.398 | |||
| Batong | 7.439 | 7.439 | |||
| Bayuin | 2.013 | 0.750 | 0.056 | 2.178 | 4.997 |
| Bugtong na Tuog | 9.323 | 5.250 | 1.280 | 21.000 | 36.853 |
| Calocmoy | 1.205 | 1.205 | |||
| Calubayan | 1.760 | 1.760 | |||
| Catiningan | 1.056 | 1.056 | |||
| Fortuna | 1.395 | 4.050 | 1.629 | 7.074 | |
| Happy Valley | 7.125 | 2.520 | 0.395 | 10.040 | |
| Leuteboro I | 0.098 | 0.098 | |||
| Leuteboro II | 7.093 | 7.093 | |||
| Ma. Concepcion | 10.010 | 3.900 | 4.158 | 6.840 | 24.908 |
| Mabuhay I | 20.340 | 8.575 | 28.915 | ||
| Mabuhay II | 5.680 | 9.000 | 1.890 | 9.080 | 25.650 |
| Malugay | 1.286 | 1.500 | 1.013 | 3.799 | |
| Matungao | 0.565 | 0.781 | 1.346 | ||
| Monteverde | 3.000 | 0.903 | 3.903 | ||
| Pasi I | 0.863 | 3.750 | 7.476 | 12.089 | |
| Pasi II | 4.260 | 5.310 | 9.57 | ||
| Sto. Domingo | 1.990 | 0.750 | 0.128 | 0.845 | 3.713 |
| Subaan | 30.380 | 18.900 | 49.280 | ||
| Villareal | 1.170 | 1.500 | 0.255 | 3.830 | 7.295 |
| Zone I | |||||
| Zone II | |||||
| Zone III | |||||
| Zone IV | |||||
| TOTAL | 96.940 | 33.450 | 10.287 | 107.804 | 248.481 |
| Source: Municipal Agriculturist's Office, 2011 | |||||
Gabi and cassava have the highest volume of production with 107.804MT and 96.94MT respectively.
Land Area (has.) Devoted to Rootcrops Production Per Barangay, 2011
| Barangay | Rootcrop | Total | |||
| Cassava | Camote | Ubi | Gabi | ||
| Bagsok | 0.10 | 0.10 | |||
| Batong | 2.15 | 2.15 | |||
| Bayuin | 0.35 | 0.25 | 0.20 | 0.55 | 1.35 |
| Bugtong na Tuog | 1.65 | 1.75 | 0.50 | 5.25 | 9.15 |
| Calocmoy | 0.33 | 0.33 | |||
| Calubayan | 0.50 | 0.50 | |||
| Catiningan | 0.30 | 0.30 | |||
| Fortuna | 0.25 | 1.35 | 0.45 | 2.05 | |
| Happy Valley | 1.25 | 1.00 | 0.10 | 2.35 | |
| Leuteboro I | 0.03 | 0.03 | |||
| Leuteboro II | 2.05 | 2.05 | |||
| Ma. Concepcion | 1.75 | 1.30 | 1.65 | 2.00 | 6.70 |
| Mabuhay I | 3.55 | 2.50 | 6.05 | ||
| Mabuhay II | 1.00 | 3.00 | 0.75 | 3.00 | 7.75 |
| Malugay | 0.25 | 0.50 | 0.30 | 1.05 | |
| Matungao | 0.10 | 0.22 | 0.32 | ||
| Monteverde | 1.00 | 0.25 | 1.25 | ||
| Pasi I | 0.15 | 1.25 | 2.10 | 3.50 | |
| Pasi II | 0.75 | 1.50 | 2.25 | ||
| Sto. Domingo | 0.35 | 0.25 | 0.05 | 0.25 | 0.90 |
| Subaan | 5.35 | 5.00 | 10.35 | ||
| Villareal | 0.30 | 0.50 | 0.10 | 1.00 | 1.90 |
| Zone I | |||||
| Zone II | |||||
| Zone III | |||||
| Zone IV | |||||
| TOTAL | 17.05 | 11.15 | 4.25 | 29.93 | 62.38 |
| Source: Municipal Agriculturist's Office, 2011 | |||||
E. Livestock and Poultry
Table below shows the livestock and poultry farm in the municipality. This consist an aggregate area of 3.25 has. Backyard and commercial piggery farms registered 713 heads while chicken (broiler production) accounted for 550 heads on the backyard scale.
Backyard livestock and poultry can be found in all 26 barangays of the municipality. Drarft animals are common in the upland barangays like wise in the rice producing areas of the municipality.
Hogs are butchered in the municipal slaughterhouse, classified as Class A based on NMIS standard and sold locally while some are being transported to Metro Manila and Pangasinan.
Rising prices of commercial feeds have caused dwindling production of backyard raisers as well as contract growers.
Inventory of Livestock and Poultry Farms, 2011
| Name of Farms | Location | Land Area Occupied (Has.) |
| 1. Fortunato Lope Piggery Farm | Leuteboro I | 0.25 |
| 2. Cueto Farm | Leuteboro I | 0.25 |
| 3. Ramos Farm | Leuteboro I | 0.25 |
| 4. Premie Magtibay Farm | Bagsok | 0.25 |
| 5. Macandili Farm | Catiningan | 0.25 |
| 6. Romero Farm | Calocmoy | 0.25 |
| 7. Gamez Farm | Villareal | 0.50 |
| 8. Dimayuga Piggery Farm | Bayuin | 0.25 |
| 9. P. Dimayuga Piggery Farm | Subaan | 0.20 |
| 10. Espina Piggery Farm | Matungao | 0.20 |
| 11. Bonquin Piggery Farm | Matungao | 0.20 |
| 12. Bagui Piggery Farm | Matungao | 0.20 |
| 13. Dimaano Piggery Farm | Matungao | 0.20 |
| TOTAL | 3.25 | |
| Source: Veterinary Services Unit, 2011 | ||
Existing Livestock and Poultry Farms, Year 2011
| Type | Area | **Classifaction | Production | ***Product Market | |
| No. of Heads | Value (M) | ||||
| *Livestock | |||||
| 1. Piggery | Backyard/ Commercial | 713 | Local/Export | ||
| *Poultry | |||||
| 1. Chicken | Backyard | 550 | Local/Export | ||
| Source: Veterinary Services Unit, 2011 | |||||
F. Fishery
Fishing is the main activity in the barangays of Pasi I and Pasi II, likewise along with farming in the Barangays of Batong Dalig, Mabuhay II and Lapog. These Barangays are located partly in the vicinity of Naujan Lake National Park (NLNP) which is considered as the only fishing ground of the municipality. Among the fishes caught at NLNP are goby (“biya” and “palawan”), tilapia, carp, mudfish and gurami. Others are marine fishes such as banak and talakitok, migratory fishes that made their way from Tablas Strait through Butas River in Naujan.
Dried Goby o “tuyong biya” is the One Town One Product (OTOP) of the municipality being only caught at NLNP and is famous for its exotic crispy taste. It is being sold in the market for P550.00 to P600.00 per kilo.
Inland fishery is composed of backyard fishponds with tilapia as the sole commodity. There are 20 barangays in the municipality with backyard fishponds covering a total of 8.5378 has. devoted to tilapia production. As reported by the Municipal Agriculture Office, the total municipal production last 2012 was 11.742MT based on the report of Barangay Food Terminal at Pasi II while inland fishery production was 0.135MT.
Based on Municipal Fisherfolk Registration System, a program launched by the Bureau of Fisheries and Aquatic Resources (BFAR) last 2013, the total number of fisherfolks in the municipality is 448 which include all fisherfolks in the lake barangays and the fishpond operators of the municipality.
In support to conservation and protection of the NLNP, three fish sanctuaries have been established. These were Lapog Fish Sanctuary, Batong Dalig Fish Sanctuary, and Pasi I Fish Sanctuary with a total of approximately 12.6 has. Barangays Mabuhay II and Pasi II will also soon establish their own sanctuary.
Support System
Support facilities like dryers and storage houses are considered inadequate. This forces the farmers to sell their product fresh and at a lower price. There is an average difference of five pesos per kilo between dried palay and fresh palay.
Agricultural Support Program and Technical AssistanceSeveral agricultural support program and technical services are provided to the Municipality of Socorro.
The Department of Agriculture thru the Provincial Agriculture Office and Municipal Agriculture Office provides inputs and technical assistance to farmers for crop and livestock production. Seminars/trainings and strengthening of community based organizations are being conducted to further the commitment of farmers to sustainable agriculture. Various forms of loans and other financial assistance are being afforded to farmers.
The LGU thru the support of the DA RFO has conducted Farmers Field School (FFS). Rice farmers were advised not to burn their rice straws and incorporate the use of organic fertilization program. Likewise, it is the farmers’ practice to plant mongo during the fallow period to enhance nitrogen fixation.
Source: Municipal Agriculture Office of Socorro, Oriental Mindoro
Municipalities

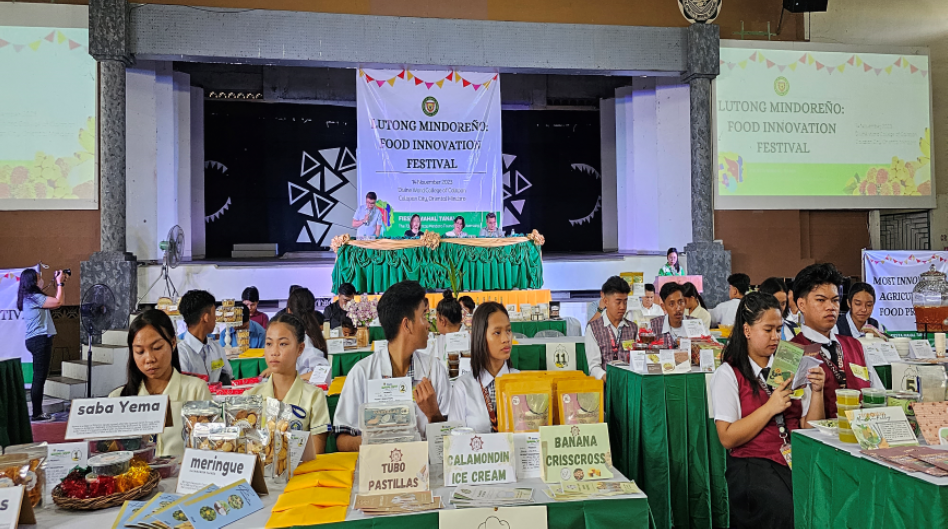
Food Innovation Festival 2023: Lutong Mindoreño

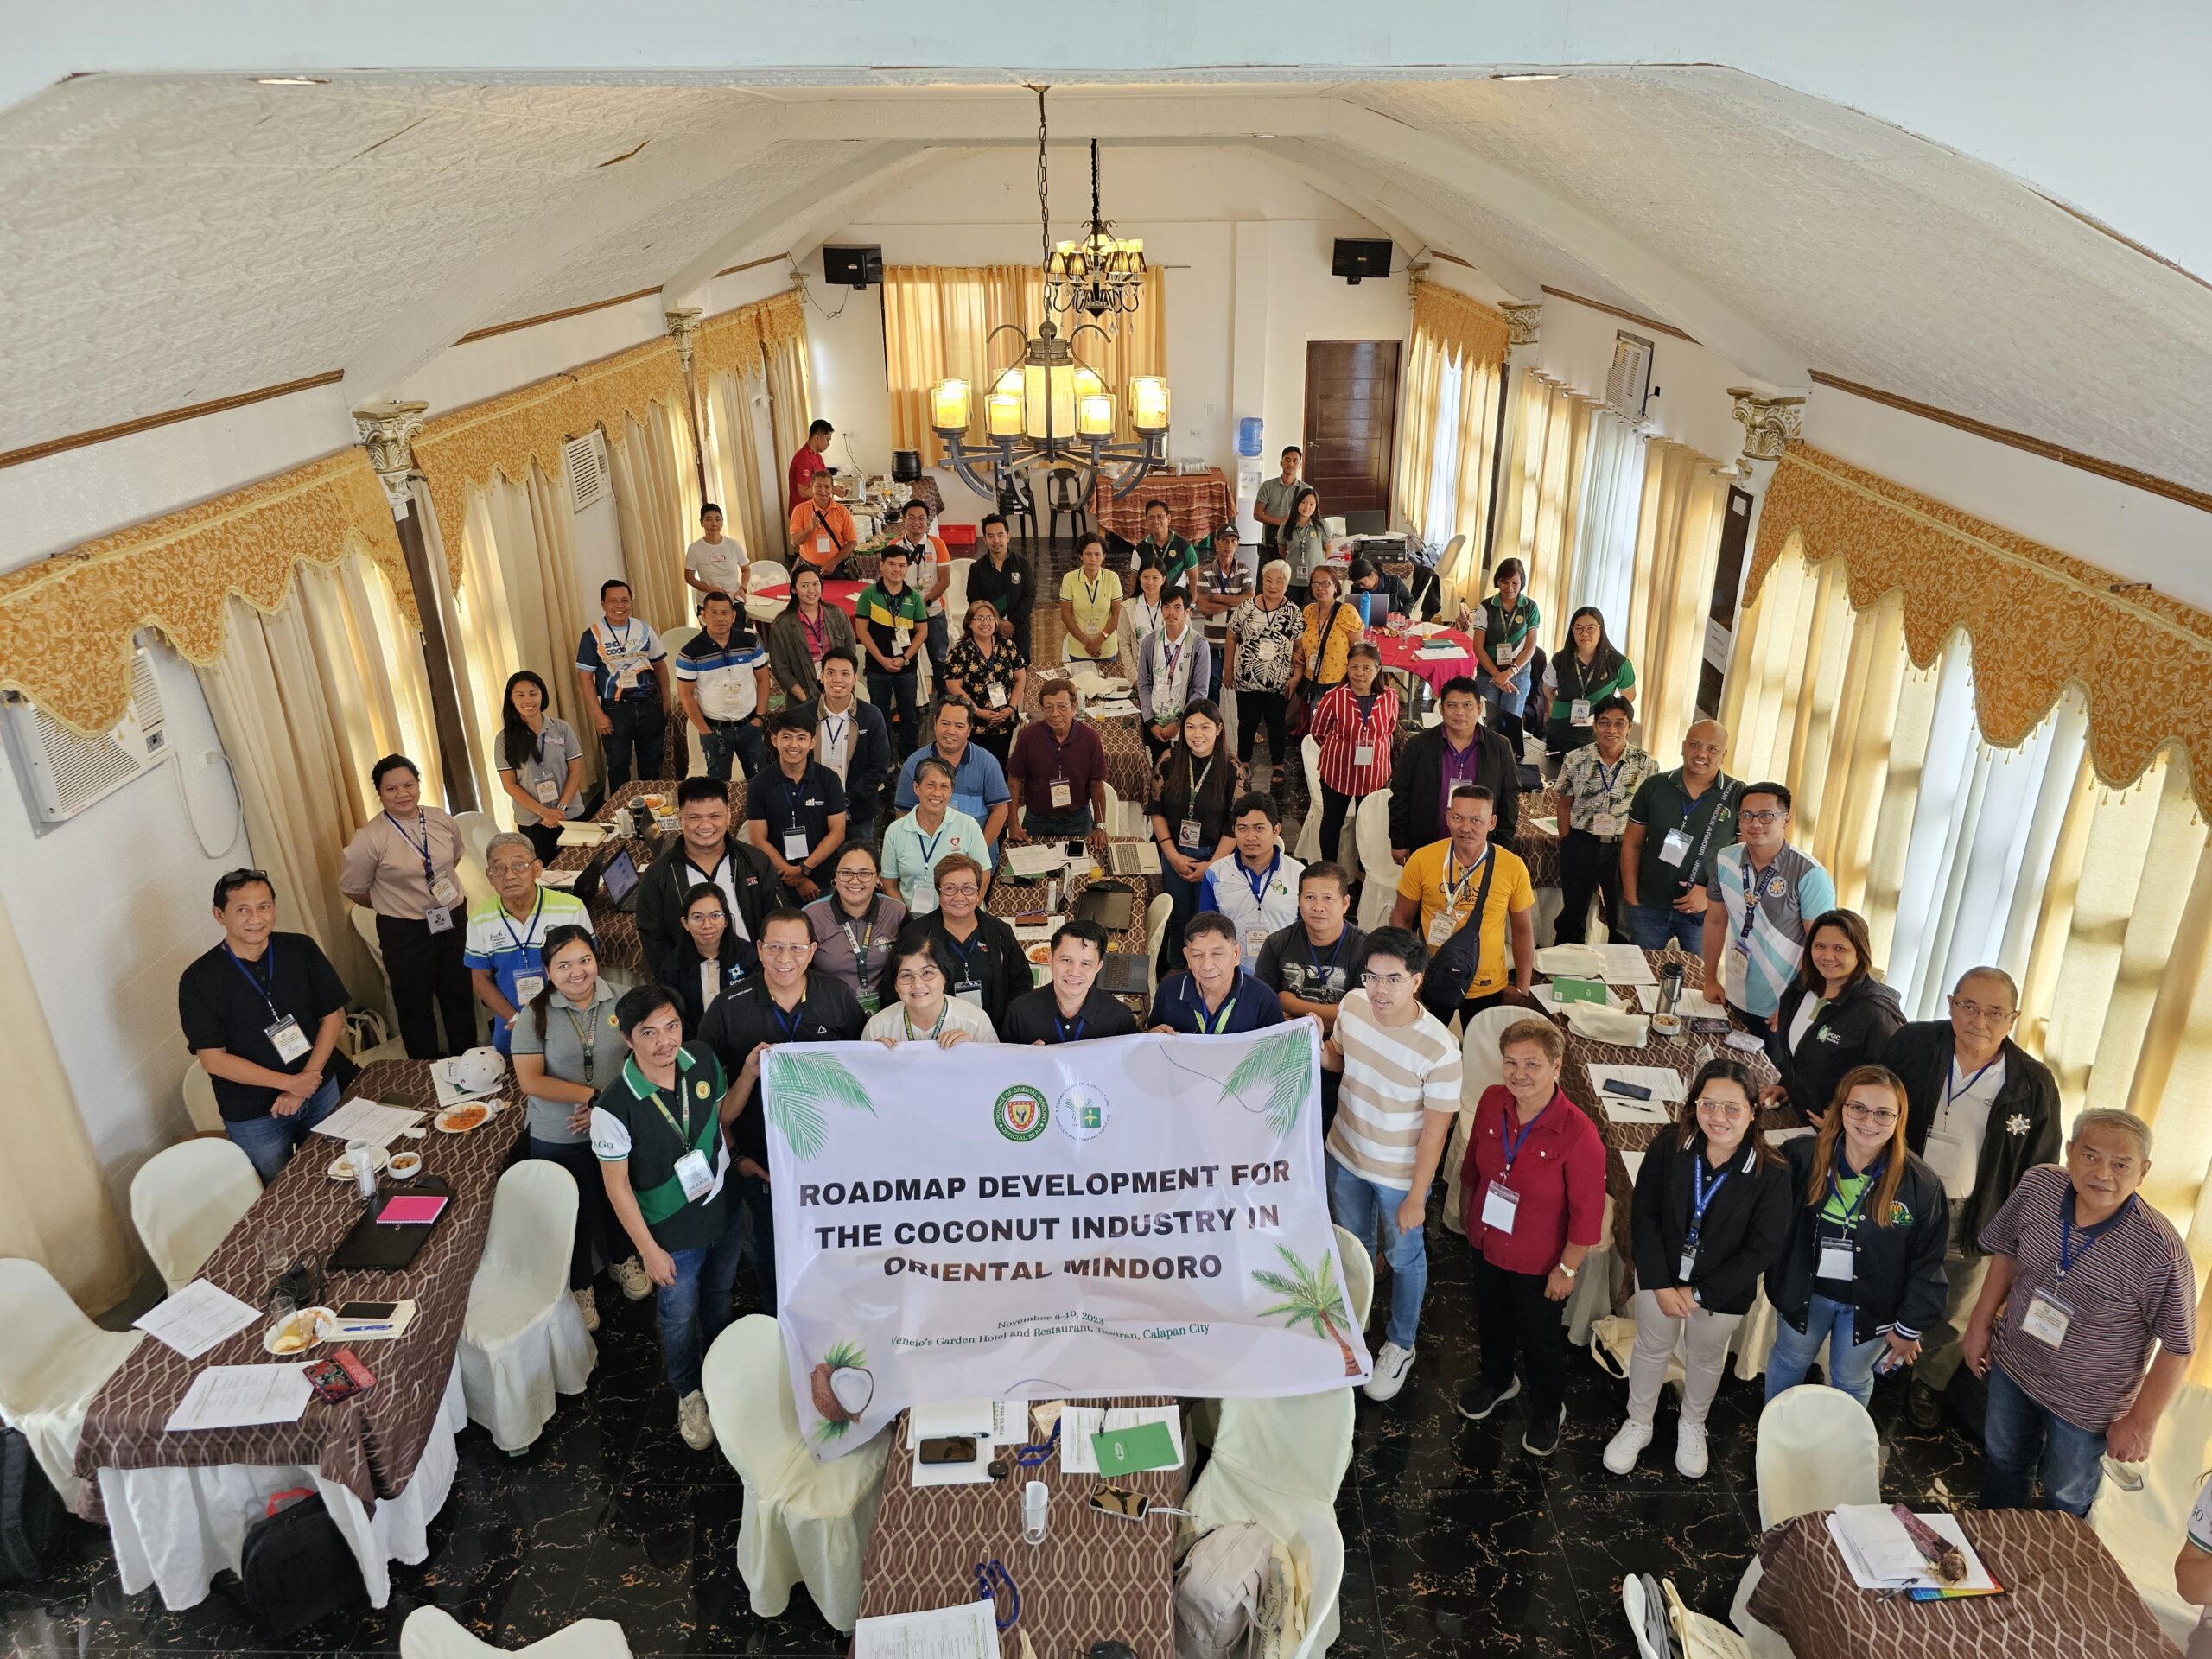
PAGO, ATI pursues Roadmap for Oriental Mindoro Priority Commodities

PAGO, MFI Raise MPA Awareness Among Youth

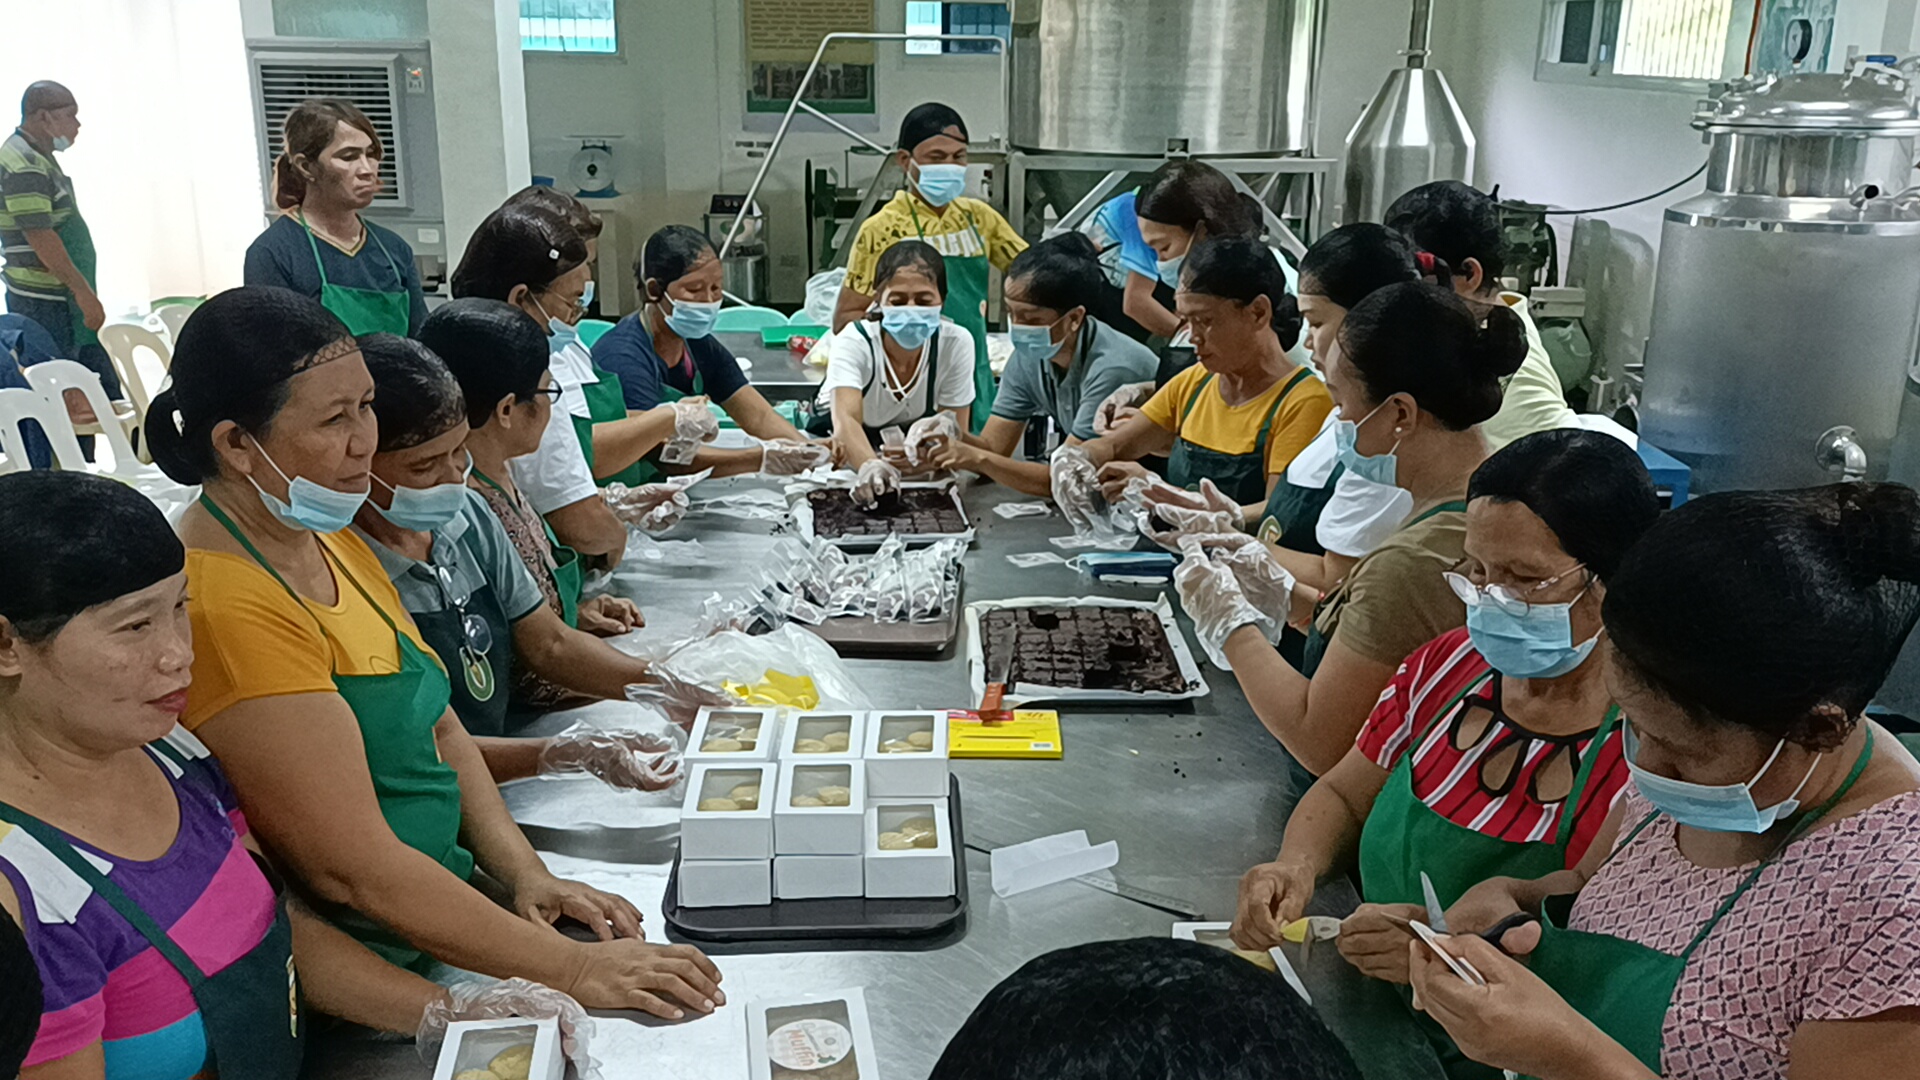
PAGO Empowers Farmers through Innovative Processing Technique
Subscribe to our AgriInfoHub newsletter and receive the latest updates, expert insights, and valuable tips to cultivate success on your farm.
