AGRI-PROFILE: nAUJAN, ORIENTAL MINDORO
Naujan, Oriental Mindoro
Naujan, officially the Municipality of Naujan, is a 1st class municipality in the province of Oriental Mindoro, Philippines. According to the 2015 census, it has a population of 102,998 people. It assumed the status of a full-fledged municipality on January 4, 1905 under Act 1280. Its boundaries were permanently established in 1919.
Agricultural Croplands
Agriculture has been the traditional and main source of income in Naujan and this sector remains as the significant catalyst of the municipality’s economic development. As per records, 29,654.334 hectares or 56% of the total land area of Naujan are devoted to agriculture while about 14,714.2 hectares or 49.62 % of the agricultural land is devoted to rice farming.
| No. | Category | Area | No. of Farmers Engaged |
| 1 | Rice | ||
| Irrigated | 12,302.90 | 5,824 | |
| Rainfed | 2,346.30 | 782 | |
| Upland | 65 | 122 | |
| 2 | Avocado | 2.3 | 10 |
| 3 | Banana | 1,130.0 | 732 |
| 4 | Black Pepper | 12.25 | 10 |
| 5 | Cacao | 54.45 | 32 |
| 6 | Calamansi | 1,360 | 680 |
| 7 | Camote | 122.05 | 58 |
| 8 | Cassava | 124.5 | 85 |
| 9 | Chico | 3.5 | 25 |
| 10 | Coconut | 1,250 | 864 |
| 11 | Coffee/Cacao | 1,025 | 341 |
| 12 | Corn | 53.25 | 35 |
| 13 | Dragonfruit | 10.0 | 8 |
| 14 | Durian | 104.10 | 95 |
| 15 | Gabi | 91.0 | 56 |
| 16 | Ginger | 15.75 | 32 |
| 17 | Hot Pepper | 20.0 | 10 |
| 18 | Lanzones | 1,531.75 | 765 |
| 19 | Mango | 95.05 | 90 |
| 20 | Pandan | 93.0 | 86 |
| 21 | Papaya | 56.68 | 30 |
| 22 | Pineapple | 28 | 20 |
| 23 | Rambutan | 825 | 620 |
| 24 | Salay | 75.3 | 98 |
| 25 | Ube | 35 | 30 |
| 26 | Vegetable | 256.15 | 2,580 |
| 27 | Forest Tree | 82 | 60 |
| 28 | Rubber Tree | 20 | 1 |
| 29 | Rattan Tree | 300 | 75 |
| 30 | Tambo Area | 50 | 35 |
| 31 | Riverbed/Sitted Area | 1,500 | |
| 32 | Pasture Area | 4,614.10 | |
| Total Agricultural Land | 29,654.38 | 14,291 | |
| Source: Municipal Agriculturist's Office, 2016 | |||
Crop Production
| Year | Irrigated | Rainfed | Lowland | ||||||
| Rice | Area (has) | PRODUCTION (mt) | Average Yield | Area (has) | PRODUCTION (MT) | Average Yield | Area (has) | PRODUCTION (mt) | Average Yield |
| 2011 | 11,552 | 46,088 | 4.0 | 2,604 | 8,332.80 | 3.2 | - | - | - |
| 2012 | 11,552 | 48,392.40 | 4.2 | 2,604 | 9,114 | 3.5 | - | - | - |
| 2013 | 11,552 | 50,120.7 | 4.35 | 2,604 | 9,660.84 | 3.71 | - | - | - |
| 2014 | 11,348 | 57,647.84 | 5.08 | 2,824 | 11,098.32 | 3.93 | - | - | - |
| 2015 | 11,634 | 84,447.12 | 4.68 | 2,844 | 11,404.44 | 4.01 | - | - | - |
| Source: Municipal Agriculturist's Office, 2016 | |||||||||
| CROPS | 2014 | 2015 | 2016 | |||
| AREA | PRODUCTION | AREA | PRODUCTION | AREA | PRODUCTION | |
| Calamansi | 1,020 | 19,125 | 1,020 | 15,937,500 | 800 | 10,000,000 |
| Banana | 1,665 | 16,650 | 900 | 9,000,500 | 900 | 765,000 |
| Coconut | 3,410 | 6,820 | 3,410 | 6,750,375 | 2,330 | 466,000 |
| Vegetable | 114 | 11,400 | 114 | 17,100 | 131 | 22,270 |
| Coffee | 302 | 2,416,000 | 302 | 2,416,000 | 250 | 125,000 |
| Cacao | 20.4 | 1,020 | 20.4 | 1,020 | 50 | 125 |
| Root Crops | 10 | 2,000 | 10 | 2,250 | 20 | 4,000 |
| Others | - | - | - | - | - | - |
| Source: Municipal Agriculturist's Office, 2016 | ||||||
Livestock and Poultry
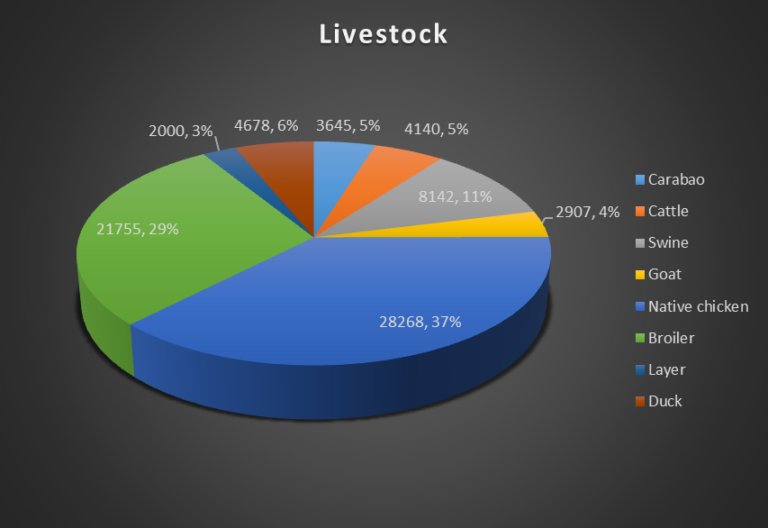
Livestock and Poultry are also being practiced in Naujan either as a source of additional income or for personal consumption purposes or both. RCBMS Census reported also that there are about 3, 427 households who are engaged in this activity.
Livestock and Poultry Inventory by Barangay, 2015
| No. | Barangay | LIVESTOCK | POULTRY | ||||||
| carabao | cattle | swine | goat | native chicken | broiler | layer | duck | ||
| 1 | Adrialuna | 61 | 5 | 124 | 20 | 526 | 250 | 587 | |
| 2 | Andres Ylagan | 20 | 50 | 15 | 20 | 230 | 210 | 52 | |
| 3 | Antipolo | 29 | 54 | 230 | 90 | 353 | 160 | 65 | |
| 4 | Apitong | 160 | 170 | 215 | 118 | 578 | 250 | 32 | |
| 5 | Arangin | 30 | 75 | 35 | 25 | 975 | 3,000 | ||
| 6 | Aurora | 94 | 154 | 400 | 50 | 104 | 1500 | 23 | |
| 7 | Bacungan | 116 | 90 | 217 | 55 | 135 | 225 | 45 | |
| 8 | Bagon Buhay | 50 | 60 | 268 | 50 | 197 | 200 | 74 | |
| 9 | Balite | 30 | 2 | 35 | 54 | 212 | |||
| 10 | Bancuro | 27 | 49 | 10 | 36 | 447 | 200 | 146 | |
| 11 | Banuton | 20 | 10 | 45 | 30 | 56 | |||
| 12 | Barcenaga | 87 | 165 | 224 | 85 | 1564 | 150 | 254 | |
| 13 | Bayani | 25 | 14 | 61 | 30 | 155 | 260 | 350 | |
| 14 | Buhangin | 38 | 44 | 48 | 35 | 450 | 350 | 1000 | 2500 |
| 15 | Caburo | 25 | 55 | 35 | 25 | 50 | |||
| 16 | Concepcion | 20 | 25 | 105 | 20 | 255 | 20 | 54 | |
| 17 | Dao | 20 | 50 | 100 | 30 | 135 | 150 | ||
| 18 | Del Pilar | 105 | 210 | 120 | 210 | 630 | 360 | ||
| 19 | Estrella | 20 | 35 | 55 | 40 | 95 | 200 | ||
| 20 | Evangelista | 80 | 100 | 100 | 65 | 2550 | 350 | ||
| 21 | Gamao | 61 | 44 | 32 | 36 | 256 | 550 | ||
| 22 | Gen. Esco | 165 | 180 | 26 | 58 | 380 | |||
| 23 | Herrera | 21 | 9 | 61 | 20 | 890 | 150 | 27 | |
| 24 | Inarawan | 168 | 56 | 15 | 100 | 450 | |||
| 25 | Kalinisan | 14 | 53 | 220 | 13 | 230 | 200 | ||
| 26 | Laguna | 50 | 50 | 200 | 30 | 680 | 300 | 360 | |
| 27 | Mabini | 25 | 63 | 30 | 19 | 225 | |||
| 28 | Magtibay | 20 | 30 | 25 | 95 | ||||
| 29 | Mahabang Parang | 130 | 200 | 89 | 46 | 138 | 350 | ||
| 30 | Malaya | 51 | 46 | 765 | 15 | 1,000 | |||
| 31 | Malinao | 39 | 30 | 100 | 15 | 150 | 150 | ||
| 32 | Malvar | 158 | 81 | 96 | 87 | 640 | 200 | ||
| 33 | Masagana | 30 | 100 | 100 | 50 | 750 | 200 | ||
| 34 | Masaguing | 10 | 2 | 15 | 15 | 250 | 150 | ||
| 35 | Melgar A | 21 | 33 | 40 | 47 | 270 | 150 | ||
| 36 | Melgar B | 23 | 36 | 8 | 31 | 150 | 150 | ||
| 37 | Mertolza | 70 | 30 | 50 | 70 | 540 | 300 | 1000 | |
| 38 | Montelago | 48 | 37 | 42 | 73 | 455 | 150 | ||
| 39 | Montemayor | 31 | 25 | 54 | 29 | 509 | 150 | 110 | |
| 40 | Motoderazo | 85 | 58 | 40 | 39 | 480 | 270 | ||
| 41 | Mulawin | 50 | 150 | 100 | 50 | 1,115 | 1,350 | ||
| 42 | Nag-iba 1 | 39 | 71 | 67 | 101 | 650 | 150 | ||
| 43 | Nag-iba 2 | 65 | 68 | 403 | 54 | 450 | 400 | ||
| 44 | Pagkakaisa | 40 | 30 | 127 | 25 | 200 | 200 | ||
| 45 | Paitan | 100 | 40 | 100 | 150 | 215 | 20 | ||
| 46 | Panikian | 17 | 21 | 40 | 25 | 60 | 550 | ||
| 47 | Pinagsabangan 1 | 55 | 30 | 350 | 40 | 480 | 150 | ||
| 48 | Pinagsabangan 2 | 90 | 48 | 185 | 52 | 350 | 250 | ||
| 49 | Pinahan | 48 | 62 | 44 | 30 | 235 | 350 | ||
| 50 | Pob. 1 | 2 | 30 | 30 | 20 | 150 | 150 | ||
| 51 | Pob. 2 | 5 | 30 | 150 | |||||
| 52 | Pob 3. | 50 | 150 | ||||||
| 53 | Sampaguita | 63 | 10 | 237 | 45 | 140 | 300 | ||
| 54 | San Agustin 1 | 18 | 74 | 194 | 11 | 500 | 350 | ||
| 55 | San Agustin 2 | 45 | 24 | 57 | 41 | 181 | 1,000 | ||
| 56 | San Andres | 98 | 48 | 168 | 37 | 360 | 250 | ||
| 57 | San Antonio | 1 | 5 | 20 | 2 | 50 | 150 | ||
| 58 | San Carlos | 60 | 30 | 192 | 40 | 300 | 200 | ||
| 59 | San Isidro | 20 | 25 | 50 | 100 | 390 | 350 | ||
| 60 | San Jose | 4 | 15 | 8 | 56 | 245 | 150 | ||
| 61 | San Luis | 125 | 149 | 84 | 10 | 210 | 250 | ||
| 62 | San Nicolas | 150 | 45 | 68 | 20 | 153 | 800 | ||
| 63 | San Pedro | 39 | 41 | 106 | 10 | 480 | 300 | 1000 | |
| 64 | Santiago | 59 | 86 | 36 | 30 | 390 | 300 | ||
| 65 | Sta. Cruz | 10 | 117 | 75 | 46 | 756 | 150 | ||
| 66 | Sta. Isabel | 50 | 10 | 150 | 12 | 550 | 150 | ||
| 67 | Sta. Maria | 190 | 170 | 240 | 90 | 745 | 350 | ||
| 68 | Sto Niño | 106 | 69 | 169 | 31 | 680 | 300 | ||
| 69 | Tagumpay | 103 | 51 | 102 | 15 | 150 | 150 | ||
| 70 | Tigkan | 54 | 24 | 190 | 60 | 440 | 300 | ||
| Sub-Total | 1865 | 1663 | 3628 | 1259 | 12149 | 10240 | 2000 | 110 | |
| TOTAL | 3645 | 4140 | 8142 | 2907 | 28268 | 21755 | 4000 | 4678 | |
| Source: Livestock Sector, Municipal Agriculture Office, 2015 | |||||||||
Livestock and Poultry Production-Consumption Relationship
| LIVESTOCK POPULATION | POULTRY POPULATION | ||
| Kind | Number of Heads | Kind | Number of Heads |
| Carabao | 3,645 | Native Chicken | 28,268 |
| Cattle | 4,4140 | Broiler | 21,755 |
| Swine | 8,142 | Layer | 2,000 |
| Goat | 2,907 | Duck | 110 |
| Source: Livestock Sector, Municipal Agriculturist's Office, 2015 | |||
Fisheries and Aquaculture
Inland Fisheries
Considering that agriculture is the major source of livelihood of the residents of Bongabong, several agricultural support programs were established to provide technical assistance. The municipality has supported the construction of much of this physical infrastructure within agriculture and forestry. Among other things, this infrastructure includes agricultural support facilities and services such as millings, multi-purpose drying pavements (MPDP) and warehouses; and transportation networks including farm-to-market roads used in transporting goods and services to and from the farm. Most of these facilities were operational.
Municipal Fisheries
Naujan covers 29,620 hectares of municipal water stretched within the 11 coastal barangays namely: Nag-Iba I, San Antonio, Estrella, Sta. Cruz, Kalinisan, San Jose, Melgar A, Melgar B, Montemayor, Masaguing and Herrera. It also covers 425.35 hectares brackish water. As per data from the Fishery Management Unit, the average fish catch for the last 5 years (2011-2015) in metric tons are: 2011- 35, 444 mt; 2012-128,804.8 mt; 2013-102,243.25 mt; 2014-214,633.30; and 2015-219,512.3 mt. The species caught were mackerel, tuna, anchovies, sardines, groupa, roundscad, kitang, mullet and other similar fish species.
In support to fishing activity, there are 3 Marine Protected Areas in Naujan, namely: Masaguing Fish Sanctuary which is about 16.0 hectares; Tujod Fish Sanctuary, 30.0 hectares; and the newly established Buloc-buloc Cove Marine Protected Area (BuCoMaPA) with an area of 72 hectares.
Commercial Fisheries
Majority of the fishermen in Naujan are considered marginalized. They usually use unmotorized banca and hook and line while some use spear fishing. Fishermen with motorized banca use either set gill nets or encircling gill nets. There are about 19 commercial fishing boats owned by the residents of the municipality, operating within 10.1-15 kms.
Food Self-sufficiency Assessment
The Food and Nutrition Resource Council set the standard requirement an individual can consume/afford with reference to income and preferences. For self- sufficiency assessment, the production of some food items should be looked into, to meet the standard requirement for the planning period. The standard requirements for agricultural products are shown in Table 56.
Standard Requirement of Various Agricultural Products
| Per Capita Dietary/Food Requirement Agricultural Product | Standard Requirement (kg/year) |
| Cereals and Cereal Product | 124 |
| Sugar and Syrups | 70 |
| Starchy Roots and Tubers | 60 |
| Vegetables | 39 |
| Fruits | 28 |
| Dried beans, Nuts and Seeds | 4 |
| Milk and Milk Products | 16 |
| Eggs | 4 |
| Fish, Meat amd Poultry | 54 |
| Miscellaneous | 7 |
| Source: Municipal Agriculturist's Office | |
Agricultural Support Facilities
Production Support Facilities
There are various agricultural support facilities established within Naujan which are of advantage to the municipality in further enhancing its local agricultural development. Local farmers are the direct beneficiaries of the services offered by these facilities. Table 57 shows the existing Agricultural Support Facilities being referred to in this section.
Existing Agricultural Support Facilities in Naujan 2016
| Agricultural Support Facility | Location |
| Agricultural Support Facility | Barcenaga |
| National Seed Quality Control Services | Barcenaga |
| Bureau of Fisheries and Aquatic Resources | Barcenaga |
| Regional Research Center | Barcenaga |
| Naujan Agricultural Center | Andres Ylagan |
| Source: Municipal Agriculturist's Office | |
Post-harvest Facilities
Majority of the rice producing barangays in Naujan have privately owned rice mill and solar drier. Some rice mills have also installed mechanical driers. There are also barangays that out of the barangay and municipal funds were able to establish solar driers for utilization of rice farmers. The National Food Authority located in Barcenaga is of great help to Naujan rice farmers in terms of storage and marketing of their produce.
Source: Municipal Agriculture Office of Naujan, Oriental Mindoro
Municipalities

Food Innovation Festival 2023: Lutong Mindoreño
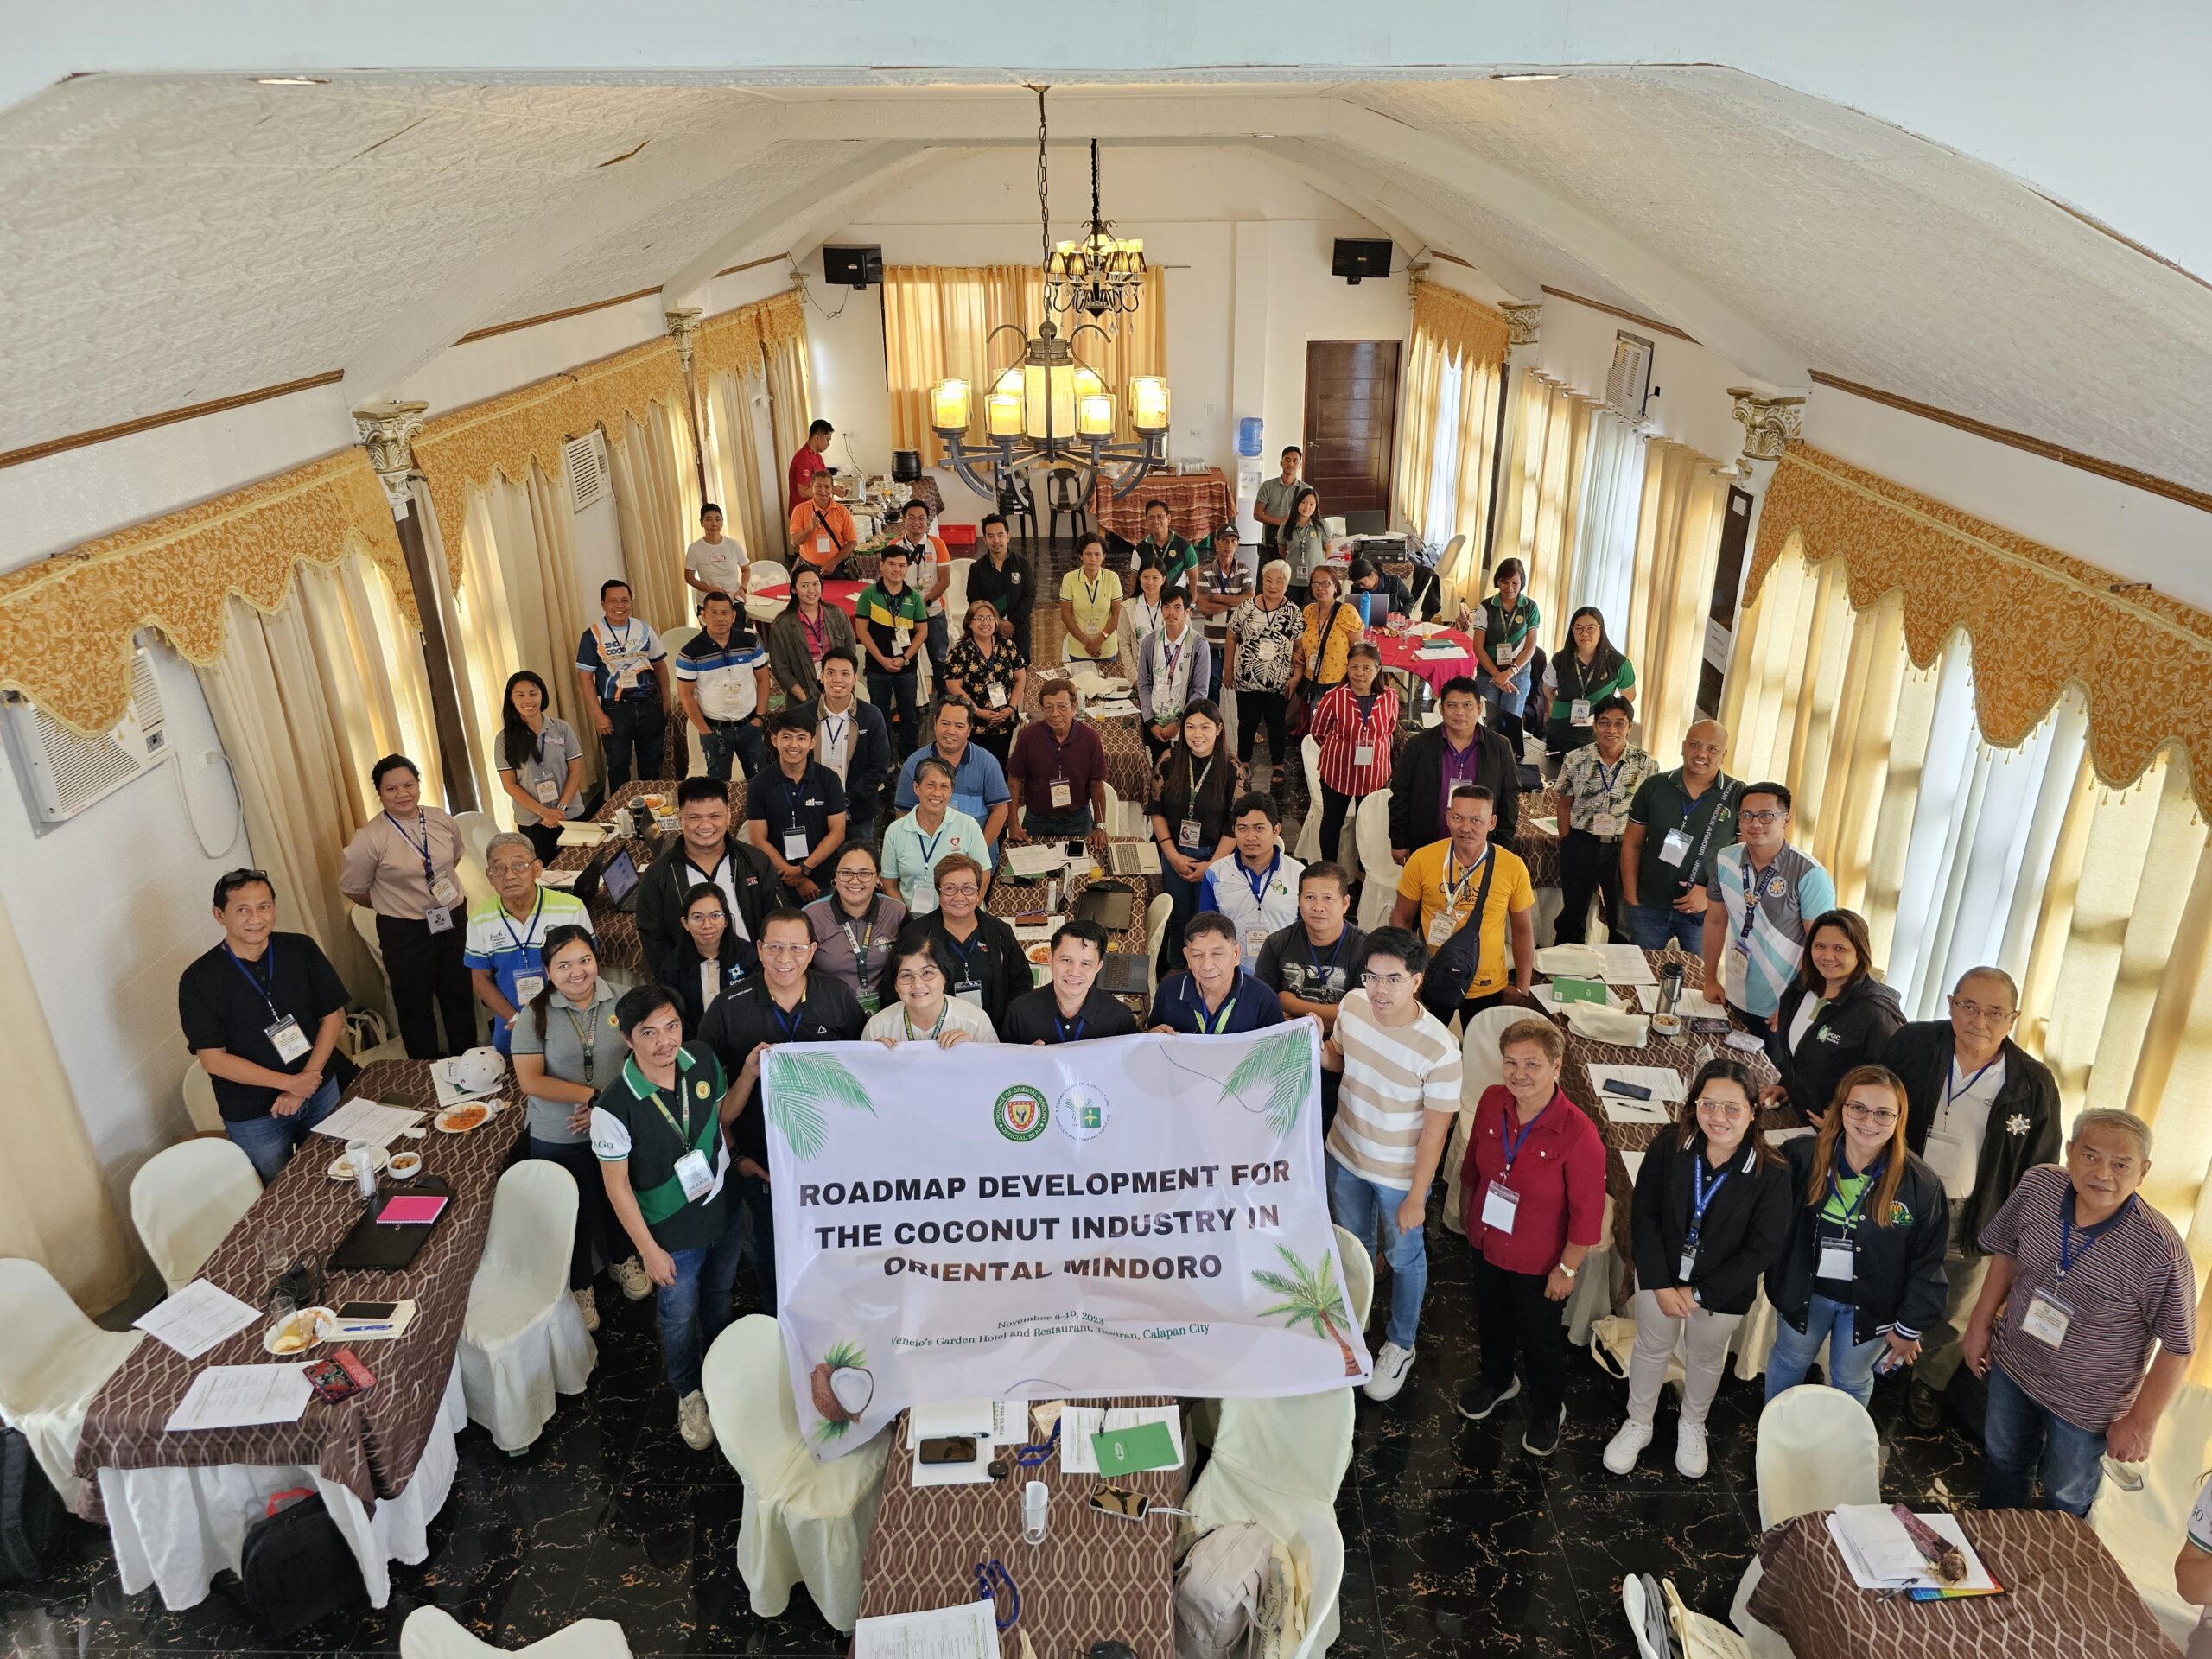
PAGO, ATI pursues Roadmap for Oriental Mindoro Priority Commodities

PAGO, MFI Raise MPA Awareness Among Youth
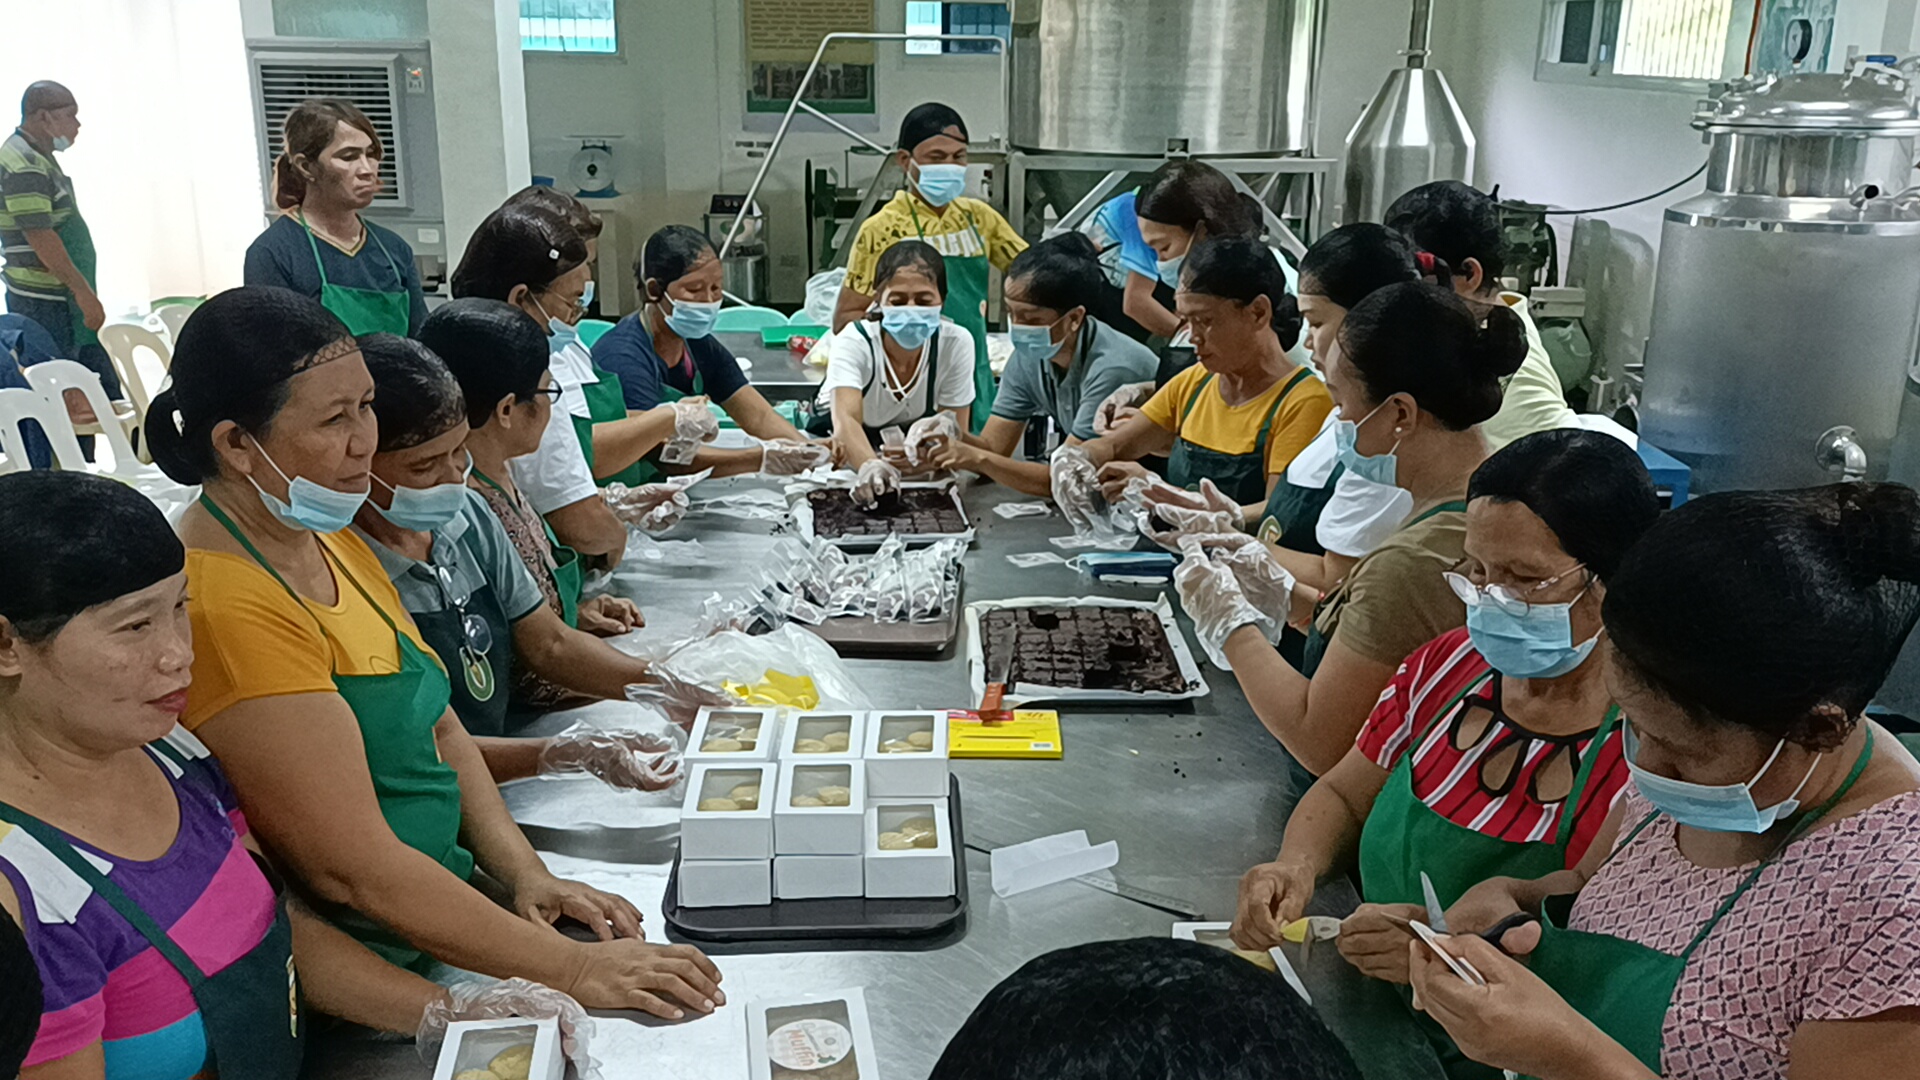
PAGO Empowers Farmers through Innovative Processing Technique
Subscribe to our AgriInfoHub newsletter and receive the latest updates, expert insights, and valuable tips to cultivate success on your farm.
